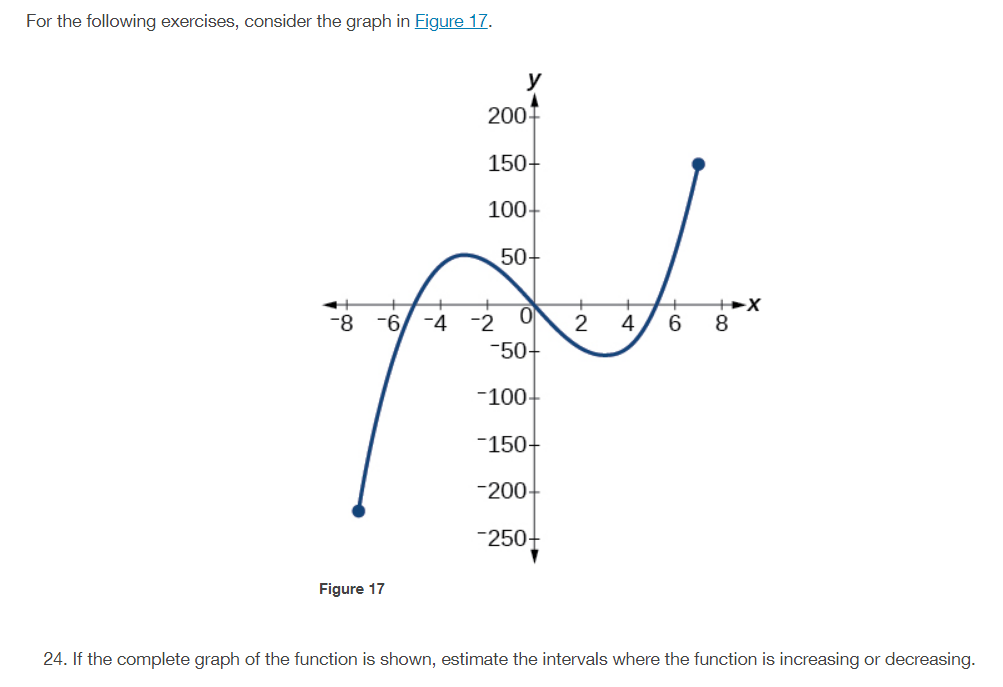
For the following exercises, consider the graph in Figure 17. 200 150 100 50- -8 -6/ -4 -2 2 4 6. 8. -50+ -100- -150- -200- -250+ Figure 17 24. If the complete graph of the function is shown, estimate the intervals where the function is increasing or decreasing.


Angles in Circles
Angles within a circle are feasible to create with the help of different properties of the circle such as radii, tangents, and chords. The radius is the distance from the center of the circle to the circumference of the circle. A tangent is a line made perpendicular to the radius through its endpoint placed on the circle as well as the line drawn at right angles to a tangent across the point of contact when the circle passes through the center of the circle. The chord is a line segment with its endpoints on the circle. A secant line or secant is the infinite extension of the chord.
Arcs in Circles
A circular arc is the arc of a circle formed by two distinct points. It is a section or segment of the circumference of a circle. A straight line passing through the center connecting the two distinct ends of the arc is termed a semi-circular arc.
Please see attached.
Thank you.


Trending now
This is a popular solution!

Step by step
Solved in 2 steps


