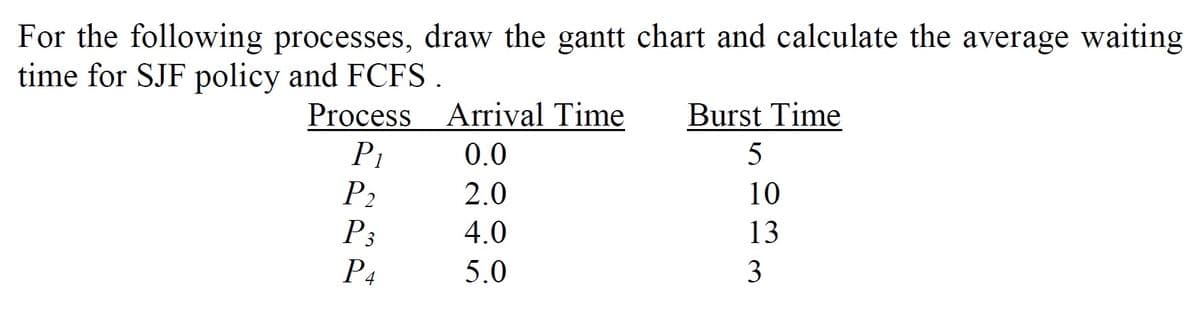
For the following processes, draw the gantt chart and calculate the average waiting time for SJF policy and FCFS. Process Arrival Time Burst Time P1 P2 P3 0.0 5 2.0 10 4.0 13 P4 5.0 3


Q: in Java What output is produced when the following program fragment is executed? for (int i = 0; i…
A: Code to run: for (int i = 0; i <= 4; i++) { for (int j = 0; j < 4 + i; j++) if (i == 4 || j ==…
Q: Is the given set of code words has a prefex property {00,11,010,100,011}
A: A prefix code is the one where no codeword is the prefix of another code. We draw binary tree of…
Q: Methods through which proximity effects the formation of a memory hierarchy
A: Answer: Memory classes work because well-written programs tend to access storage at any particular…
Q: 1. Simplify the boolean expressions: а. А * (А+ B +C)+ B* (А'+ В') b. A * ( A' + B' + D' ) + C * ( C…
A:
Q: Which is preferable, data or control level parallelism? What are the benefits of MIMD's programmatic…
A: Answer: Yes, SIMD is better suited to data or control-level parallelism. However, both SIMD and MIMD…
Q: Furthermore, the context in which object-oriented analysis and design is used is advantageous; for…
A: Object-oriented analysis and design (OOAD) is a technical approach that uses the Object Oriented…
Q: What does "protection of personal information" mean? What are the top five ways to protect your…
A: Personal information comprises the number, address, bank account information, etc. If we do not…
Q: Question 3. Define a function that satisfies the following specifications. generate_ qns from list…
A: Python code for the asked program is given in the next step by using list operations.
Q: When you execute your program it should ask user to input any number then check if the number is…
A: Introduction: Here we are required to create a program that will check the divisibility of an number…
Q: Explain what application metadata is and provide examples of what it may be used for. In the realm…
A: Metadata: There are many methods to define metadata: Data that offer context for other data.…
Q: What is a Cloud Technology?
A: Users can access storage, data, software, and servers over the cloud using any internet-connected…
Q: How does the internet function, and what are the many gadgets that are connected to it?
A: THE WAY THE INTERNET WORKS: According to Wikipedia, the internet is described as a computer network…
Q: Using PHP and PHP arrays, Please create a script that makes a complete online shopping cart, where…
A: In the following code, I have designed the landing page with two main sections for the products and…
Q: 24. What will the following code print out def func(x): print (x) func (10) func (20) b. func 10 d.…
A: Python is a very famous programming language these days, It is an Object oriented programming,…
Q: Identify firewalls as a critical component of network security. Define the term and provide specific…
A:
Q: 15. What does the pythôn "input Read the memory of the running program b. Take a screen shot from an…
A: 15. D ( Pause the program and read data from user) input() : x=input("Enter x value") print(x)…
Q: In terms of network security, what are the differences between the Red, Blue, and Purple teams?
A: Introduction: Here we are required to explain what are the differences between the Red, Blue, and…
Q: So, what exactly does "cooperative" multithreading imply in the context of a multithreading system?…
A: Cooperative Multi threading: Cooperative multi threading is a kind of computer multi threading in…
Q: The Information Systems Audit Departmentť's IT Department
A: Auditability is one of the major task carried in an organisation, whether it be IT organisation or…
Q: a. Consider the following (2, 4) tree: (2, 4) Tree 4 3 6 10 What is the sequence of keys encountered…
A: Here in this question we have given a 2 4 tree and we have asked to find out the sequence for…
Q: Where applicable, adopt object oriented design. When the context asks for it, structured design is…
A: Define: A programming language uses objects, as the name indicates. Things like hiding and…
Q: How will the Internet of Things (loT) affect us? Give an example of a smart device or app.
A: How will the Internet of Things (loT) affect us? Give an example of asmart device or app.
Q: a) Define as fallows;1- crosstalk 2- commutator 3- distributer 4- Guard time 5- aliasing b) List the…
A: 1) Crosstalk - Crosstalk is a type of noise signal that damage the actual signal while transmission…
Q: Stateful packet inspection (SPI) protects the network by inspecting each and every packet.
A: Stateful packet inspection (also known as dynamic packet filtering) is a technique for checking…
Q: 22. For the following code astr . 'Hello Bob' istr - 0 try: istr - int(astr) except: istr - -1 What…
A: EXPLANATION: The variable astr is defined as the string variable in the given program code. The…
Q: 1. Components of DSS include: A. The user interface, the database, the models and analytical tools,…
A: The components of DSS include: 1. DSS database: The database is drawn on the basis of different…
Q: List out the benefits of biometric authentication?
A: List out the benefits of biometric authentication?
Q: Define the lifespan and visibility of a name-to-object binding.
A: The duration of a binding of a name to an item is defined as follows: Referencing environment: The…
Q: i need the answer quickly
A: Answer to the given question: The first step to converting octal to hex is to convert octal to…
Q: Give a real-world example of the word "foreign key" and explain what it means.
A: - We need to talk about the foreign key.
Q: If a "WORM" assault is used against a content delivery network, what are the ramifications? What can…
A: Define: A computers a piece of code that may propagate from one framework to another. An infection…
Q: Use a software program or graphing utiity with matrix capabities to decode the cryptogram. 0-1 -2 -2…
A:
Q: 2. Python scripts (fil(es) have names that end with: a. .py d. .exe b. png c. .doc 3. Which of this…
A: i have provided this answer with full description step-2.
Q: Digital forensics includes a significant and consequential component: the documentation and…
A: Digital forensics: A digital forensic imaging method is described as the techniques and technologies…
Q: To what end do TCP-based protocols like HTTP, SMTP, and POP3 serve?
A: Given that: HTTP, FTP, SMTP, and POP3 protocols all demand that application data be received in the…
Q: What is the purpose of MATLAB/OCTAVE Workspace and Command Window?
A: Answer: The purpose of Command Window is it enables you to enter individual statements at the…
Q: Explain the benefits and drawbacks of nested classes in OOP (OOP).
A: Nested classes have an advantage in OOPs. A class declaration may be nested within the definition of…
Q: What are the notions of overflow and underflow, as well as their causes?
A: Overflow: Overflow is the outcome of an equation occurring that is too large for the format to…
Q: Recording changes to information systems is one of the key objectives of digital forensics. Is it…
A: Digital forensics is the practice of maintaining, identifying, extracting, and documenting digital…
Q: A computer's internal components are what allow it to perform. In a nutshell?
A: Explanation: Syntax, documentation, error messages, and exception handling are the most important…
Q: Discussion on network and cyber security breaches as well as methods to prevent them is encouraged.
A: Explanation: A range of network and cyber security breaches should be known to everyone. Types of…
Q: Cybercrime Investigation: How Crucial Is It Today in the Battle Against It?
A: Cybercrime Investigation: A cyber crime investigation is the process of examining, analyzing, and…
Q: An explanation of what occurs when students connect their laptop to the school's LAN and access the…
A: Introduction: This network connects PCs and peripherals using a single conventional communications…
Q: Justify the relevance of traffic analysis as a vital network defence and cJustify the role of…
A: To be decided: Justify the relevance of traffic analysis as a critical component of network defense…
Q: In recent years, the utilization of symmetric multiprocessing systems has become more prevalent.…
A: SMP (symmetric multiprocessing): SMP (symmetric multiprocessing) is computer processing performed by…
Q: an odd number Parity
A: Given :- In the above given question, an odd number parity check is mention in the above given…
Q: An overview of how secure Internet transport is provided via connection-oriented operations should…
A: The protocols involved in the transport layer manage the end-to-end communication.
Q: A personal database system and an enterprise-class database system vary greatly in terms of features…
A: DBMS: DBMS refers to a database management system.Every organization has its database management…
Q: The goal of forensic software is to give particular investigation skills, but how exactly does it…
A: Explanation: Forensic software can automate numerous review operations, in addition to taking disc…
Q: The distinction between multiprogramming and multithreading is explained belo
A: Multiprogramming entails: Multiprogramming is the process of executing numerous programmes at the…

Step by step
Solved in 2 steps with 2 images


- What is a process scheduler, and how does it work? How would you describe the features of an effective process scheduler?Make a basic six-step plan for hardening network servers. Describe how the plan will be executed and managed.What physical storage and access is there for the schedule management system?
- Describe various scheduling tools, including Gantt charts and PERT/CPM chartsDeadlocks are related to Inter process Communication (IPC), explains in details the interrelationships of deadlocks: processes, resources, process state, and scheduling on Operating System Linux/Unix ?How do load balancers operate at the application layer of the OSI model?
- 1.How do we call a situation when process is executed at a different site than the one which initiated it: A) process delegation B) process migration C) resource sharing D) resource allocation 2.What is NOT a valid the reason for a process migration: A) hardware preference B) software preference C) load balancing D) privilege escalation 3.Which scheme is commonly used for large-scale parallel computations : A) GFS B) MapReduce C) NFS D) OpenAFS 4.What can be used to ensure reasonable performance of a remote-service mechanism: A) direct memory access B) shared memory C) caching D) shared dataProcesses do not require explicit IPC mechanisms in order to share data. T OR FThe requesting process is caught in an endless cycle of waiting because another process has previously requested the identical resource. Explain THREE (3) different ways to end the impasse using real-world situations.
- For each of the following requirements, identify the best choice of degree of durability in a remote backup system: a. Data loss must be avoided, but some loss of availability may be tolerated. b. Transaction commit must be accomplished quickly, even at the cost of loss of some committed transactions in a disaster. c. A high degree of availability and durability is required, but a longer running time for the transaction commit protocol is acceptable.By using Microsoft Access, create tables (2 or more tables) with any details for network management system or network management Here I do not want tables related to something other than what you asked in the questionWhat are the top three database administrator tasks? How do we choose LAN maintenance strategies?