For the following sample: a. Assume that the scores are measurements of a continuous variable and find the median by locating the precise midpoint of the distribution
For the following sample: a. Assume that the scores are measurements of a continuous variable and find the median by locating the precise midpoint of the distribution

Glencoe Algebra 1, Student Edition, 9780079039897, 0079039898, 2018
18th Edition
ISBN:9780079039897
Author:Carter
Publisher:Carter
Chapter10: Statistics
Section10.4: Distributions Of Data
Problem 19PFA

Related questions
Question
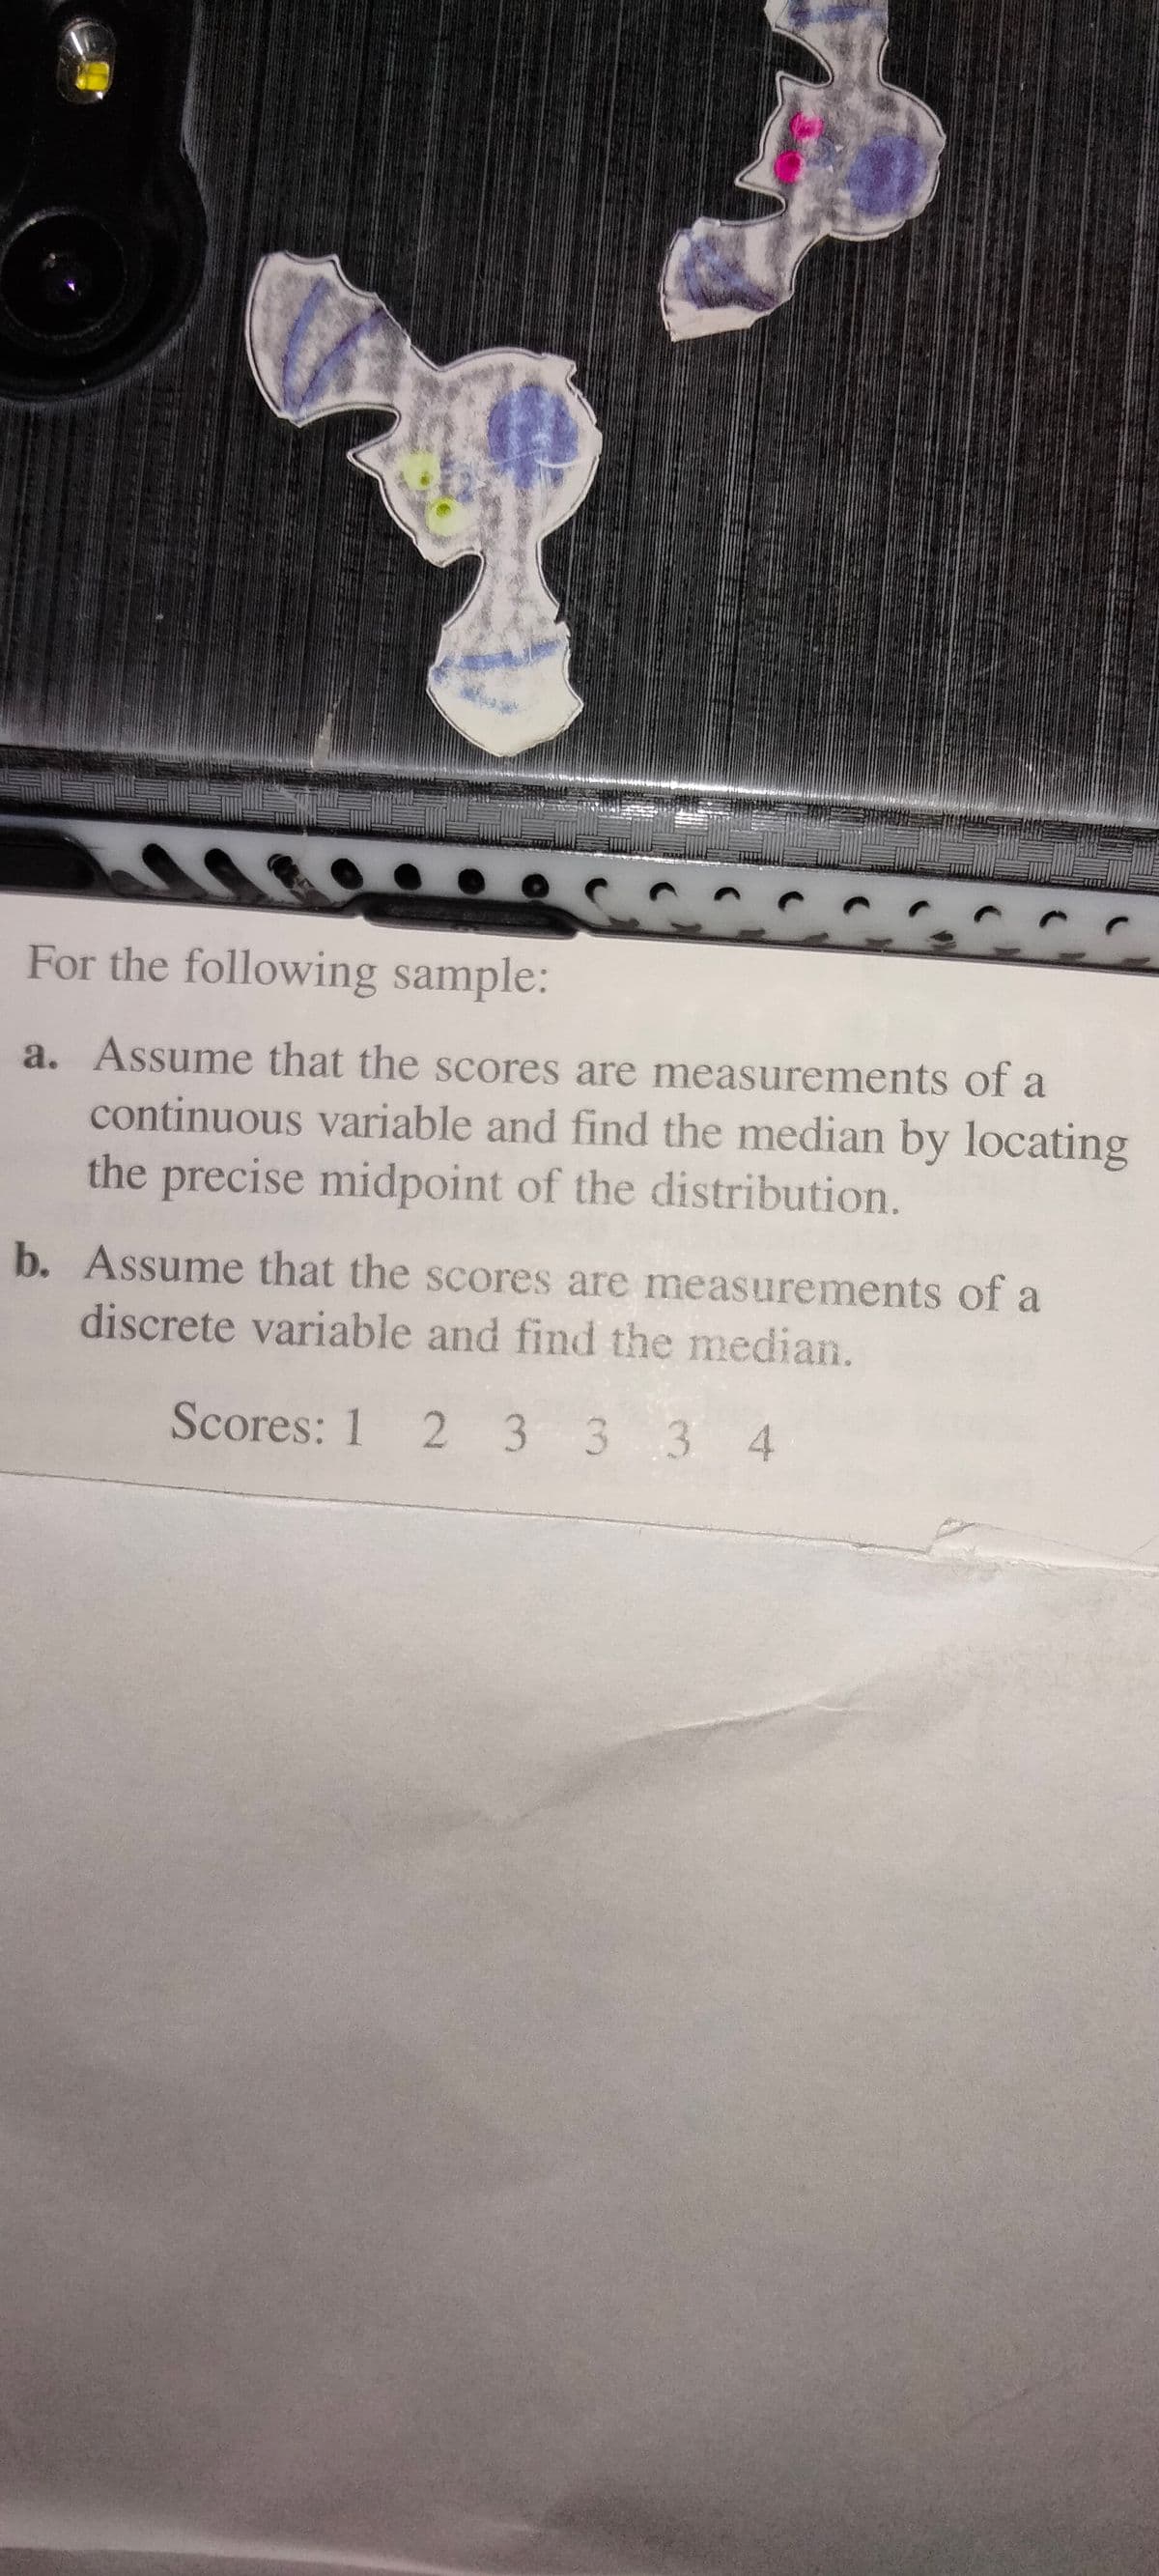
Transcribed Image Text:For the following sample:
a. Assume that the scores are measurements of a
continuous variable and find the median by locating
the precise midpoint of the distribution.
b. Assume that the scores are measurements of a
discrete variable and find the median.
Scores: 1 2 3 3 3 4
Expert Solution
This question has been solved!
Explore an expertly crafted, step-by-step solution for a thorough understanding of key concepts.

This is a popular solution!

Trending now
This is a popular solution!

Step by step
Solved in 2 steps with 2 images

Recommended textbooks for you
Glencoe Algebra 1, Student Edition, 9780079039897…
Algebra
ISBN:
9780079039897
Author:
Carter
Publisher:
McGraw Hill
Glencoe Algebra 1, Student Edition, 9780079039897…
Algebra
ISBN:
9780079039897
Author:
Carter
Publisher:
McGraw Hill