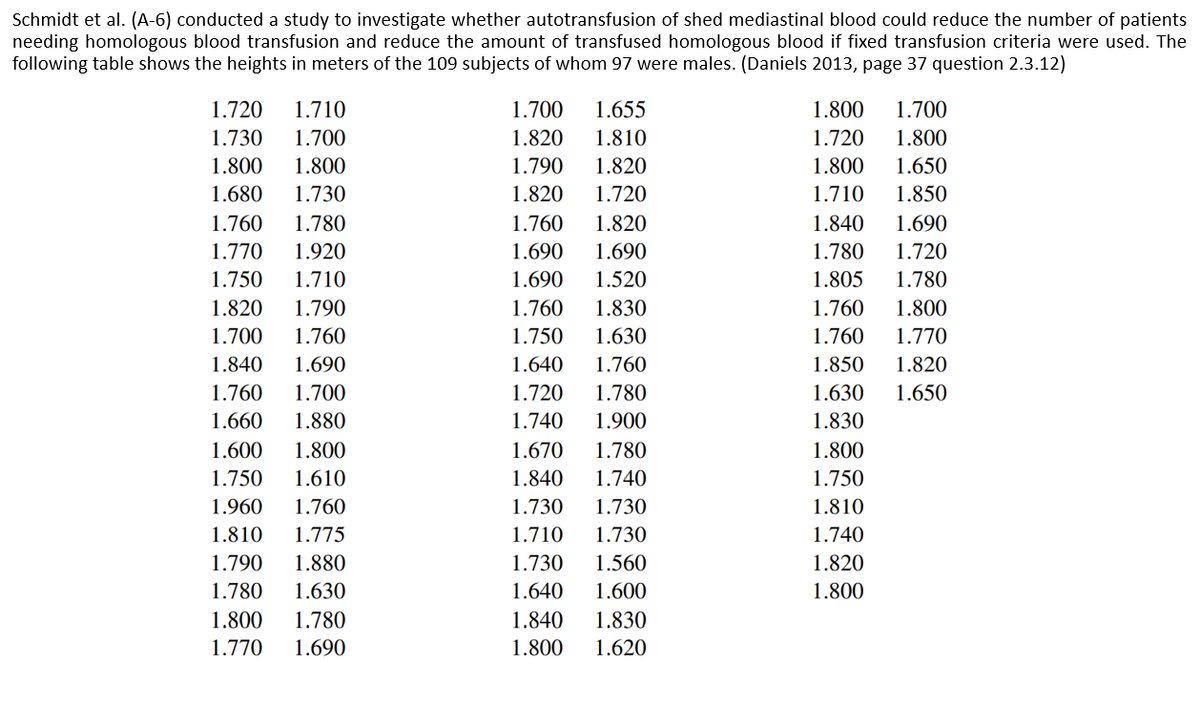
For these data: Construct frequency distribution table showing: frequency, relative frequency, cumulative frequency, and cumulative relative frequency. 1. Construct a histogram and frequency polygon. Describe these data with respect to symmetry and skewness. How do you account for the shape of the distribution of these data? How tall were the tallest 6.42 percent of the subjects? How tall were the shortest 10.09 percent of the subjects? 2. Compute the mean, median, variance, standard deviation, first quartile, third quartile, and interquartile range. (I already did this one so feel free to not include it) 3. Are the mode, median, and mean equal? If not, explain why. Discuss the data in terms of variability. Compare the IQR with the range. What does the comparison tell you about the variability of the observations? 4.


Inverse Normal Distribution
The method used for finding the corresponding z-critical value in a normal distribution using the known probability is said to be an inverse normal distribution. The inverse normal distribution is a continuous probability distribution with a family of two parameters.
Mean, Median, Mode
It is a descriptive summary of a data set. It can be defined by using some of the measures. The central tendencies do not provide information regarding individual data from the dataset. However, they give a summary of the data set. The central tendency or measure of central tendency is a central or typical value for a probability distribution.
Z-Scores
A z-score is a unit of measurement used in statistics to describe the position of a raw score in terms of its distance from the mean, measured with reference to standard deviation from the mean. Z-scores are useful in statistics because they allow comparison between two scores that belong to different normal distributions.

Step by step
Solved in 6 steps with 2 images


