Please answer the following questions within the appropriate column in the table below: I. Using the provided data and graphs, describe the frequency distribution for the IQ test: a) What is a typical score for this sample? b) How variable are the scores? c) How are the scores distributed? A) 98 B) | II. Using the provided data and graphs, describe the frequency distribution of the reading test scores: a) What is a typical score for this sample? b) How variable are the scores? c) How are the scores distributed? III. Consider the correlation data given the provided data and graph: a) How are IQ and reading achievement related?
Please answer the following questions within the appropriate column in the table below: I. Using the provided data and graphs, describe the frequency distribution for the IQ test: a) What is a typical score for this sample? b) How variable are the scores? c) How are the scores distributed? A) 98 B) | II. Using the provided data and graphs, describe the frequency distribution of the reading test scores: a) What is a typical score for this sample? b) How variable are the scores? c) How are the scores distributed? III. Consider the correlation data given the provided data and graph: a) How are IQ and reading achievement related?

Glencoe Algebra 1, Student Edition, 9780079039897, 0079039898, 2018
18th Edition
ISBN:9780079039897
Author:Carter
Publisher:Carter
Chapter10: Statistics
Section: Chapter Questions
Problem 10PT

Related questions
Question
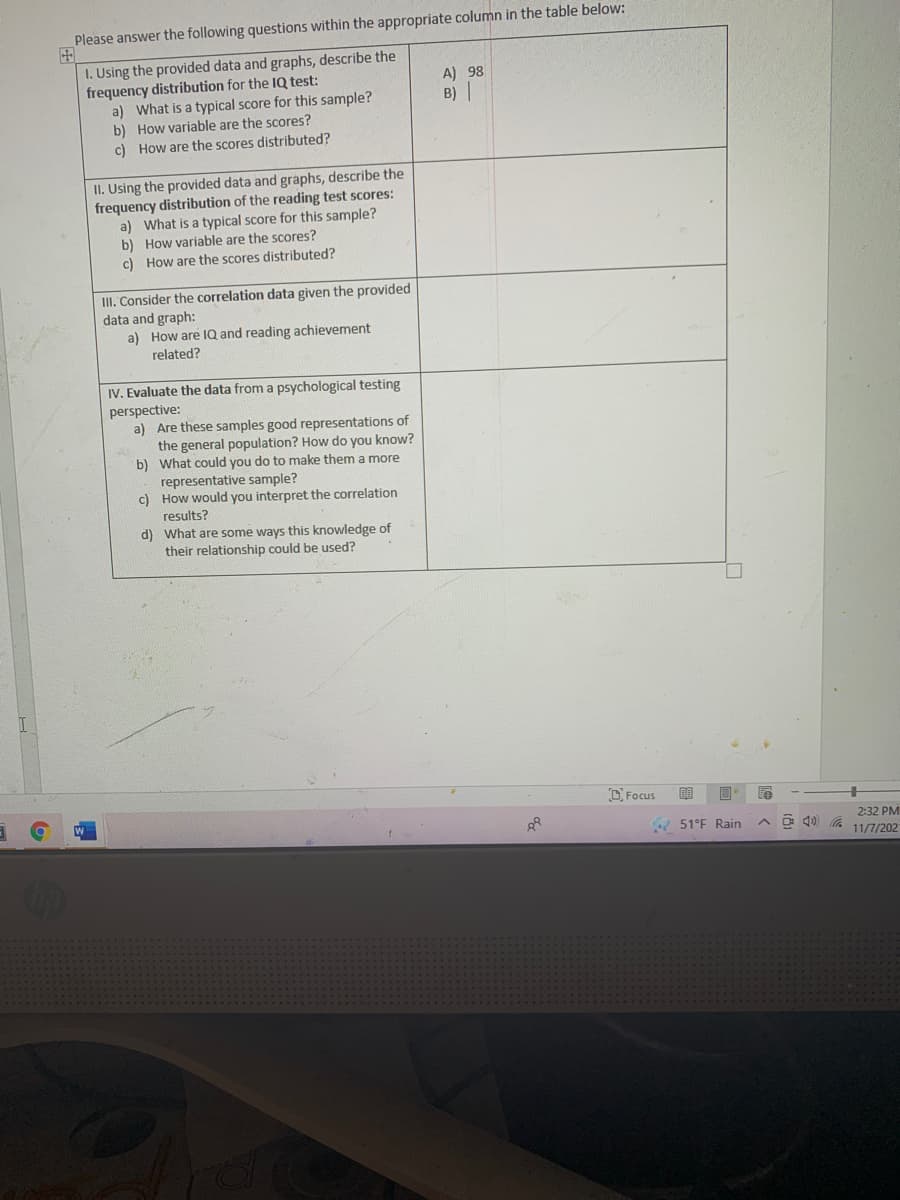
Transcribed Image Text:Please answer the following questions within the appropriate column in the table below:
田
I. Using the provided data and graphs, describe the
frequency distribution for the IQ test:
a) What is a typical score for this sample?
b) How variable are the scores?
c) How are the scores distributed?
A) 98
B)|
II. Using the provided data and graphs, describe the
frequency distribution of the reading test scores:
a) What is a typical score for this sample?
b) How variable are the scores?
c) How are the scores distributed?
II. Consider the correlation data given the provided
data and graph:
a) How are IQ and reading achievement
related?
IV. Evaluate the data from a psychological testing
perspective:
a) Are these samples good representations of
the general population? How do you know?
b) What could you do to make them a more
representative sample?
c) How would you interpret the correlation
results?
d) What are some ways this knowledge of
their relationship could be used?
DFocus
2:32 PM
A 51°F Rain
11/7/202
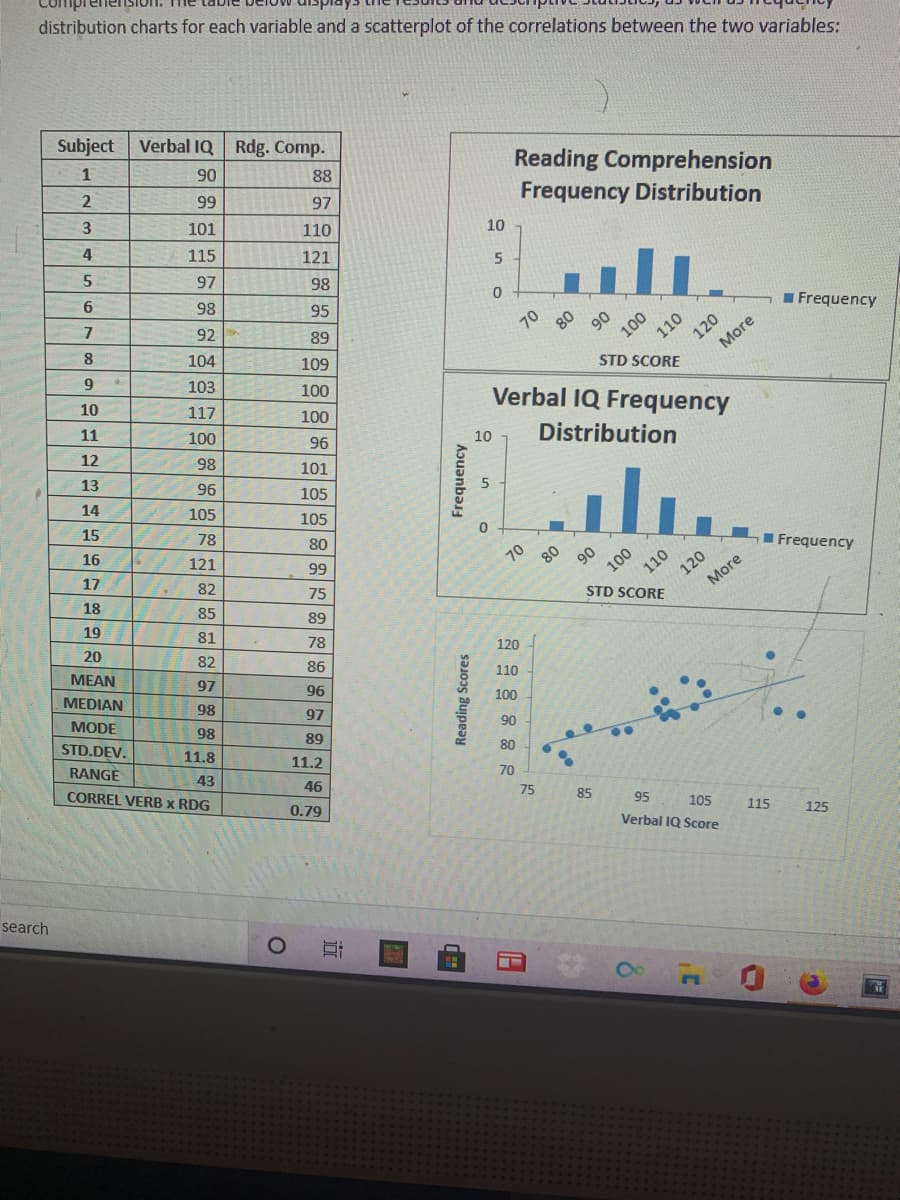
Transcribed Image Text:distribution charts for each variable and a scatterplot of the correlations between the two variables:
Subject
Verbal IQ Rdg. Comp.
Reading Comprehension
Frequency Distribution
1
90
88
2
99
97
3
101
110
10
4
115
121
5
97
98
98
95
I Frequency
10
120
More
92
89
8
104
109
STD SCORE
9
103
100
Verbal IQ Frequency
10
117
100
11
100
Distribution
96
10
12
98
101
13
96
105
14
105
105
15
78
80
16
10
IFrequency
121
120
More
99
17
100
110
82
75
STD SCORE
18
85
89
19
81
78
20
120
82
86
MEAN
110
97
96
MEDIAN
100
98
97
MODE
90
98
89
STD.DEV.
80
11.8
RANGE
11.2
70
43
CORREL VERB x RDG
46
75
85
95
105
Verbal IQ Score
0.79
115
125
search
Frequency
近
Reading Scores
110
Expert Solution
This question has been solved!
Explore an expertly crafted, step-by-step solution for a thorough understanding of key concepts.

This is a popular solution!

Trending now
This is a popular solution!

Step by step
Solved in 3 steps

Recommended textbooks for you
Glencoe Algebra 1, Student Edition, 9780079039897…
Algebra
ISBN:
9780079039897
Author:
Carter
Publisher:
McGraw Hill
Glencoe Algebra 1, Student Edition, 9780079039897…
Algebra
ISBN:
9780079039897
Author:
Carter
Publisher:
McGraw Hill