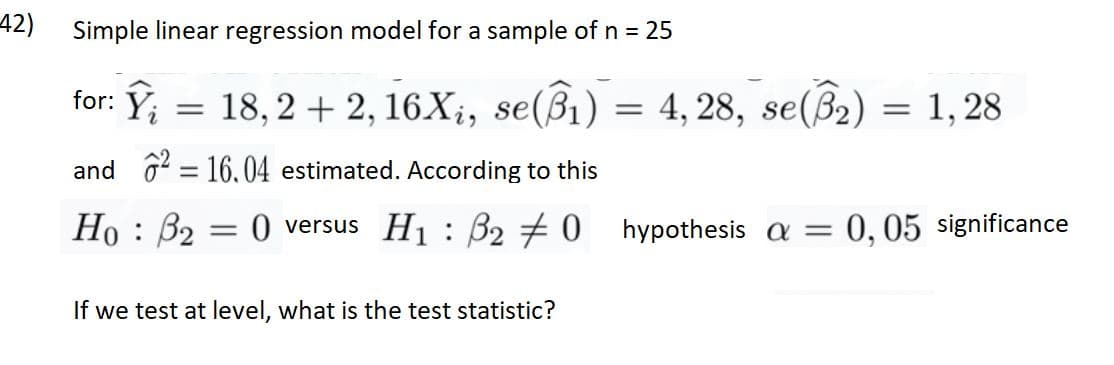
for: Ý; = 18, 2 + 2, 16X;, se(ß1) = 4, 28, se(B2) = 1, 28 and 6 = 16.04 estimated. According to this %3D Ho : B2 = 0 versus H1 : B2 0 hypothesis a = 0, 05 significance %3D If we test at level, what is the test statistic?


Q: 2. Approximate the value of ſS (x² + y² +2) dA where R= [0,1] × [0, 1] using m = n = 2 and R sample…
A: To approximate ∬Rx2+y2+2dA where R=0,1×0,1 with m=n=2 and the sample points that give an…
Q: As we have noted in previous chapters, even a very small effect can be significant if the sample is…
A: Given, Correlation coefficient, r = 0.60 sample size n = 10 Degree of freedom, n-2 = 8 α = .05…
Q: Given y; = Bo + B1(x; – µ) + ɛ¿ , find the OLS estimator for B1. Is this estimator unbiased? Why or…
A: Given Information: yi=β0+β1xi-μ+εi
Q: One advantage of a correlated-groups design is that the effects of ---- have been removed. *…
A:
Q: In quartiles Q_1 is represented as % of the that value till which data is covered. Select one: а. 75…
A:
Q: A paired difference experiment yielded the results shown below. na = 45 Xd = 16.4 a. Test Ho: Hd =…
A:
Q: A meal box enterpreneur wants to know how the meal box size (in centimeters) of parents compares to…
A: 1. The hypotheses are given below: Null hypothesis: H0:Md=0 Alternative hypothesis: H1:Md>0 2.…
Q: (e) You wish to test the null hypothesis Họ: µz 244 mg/100 ml against the alternative HA: µ<244…
A:
Q: Question 16: Test the claim that the proportion of people who own cats is larger than 50% at the…
A:
Q: and an 24. A repeated-measures, à independent-measures study all produce a t statistic with df = 16.…
A: The degrees of freedom for the repeated measures t statistic can be calculated as: DF = n-1 For…
Q: From, the information given below calculate Karl Pearson's coefficient of skewness and also quartile…
A:
Q: The data below are from an independent-measures experiment comparing three different treatment…
A:
Q: An independent-measures study comparing two treatment conditions produces a t statistic with df =…
A: Provided information: Degrees of freedom = 18 Two samples are the same size.
Q: The critical values associated with a 80% Cl for the population mean when x = 12.5, %3D n 13 and o…
A:
Q: A question of medical interest is whether jogging leads to a reduction in systolic blood pressure.…
A: a) Given claim: A question of medical interest is whether jogging leads to a reduction in systolic…
Q: As noted on page 275, when the two population means are equal, the estimated standard error for the…
A: 1. Let the null hypothesis be H0: μ1=μ2. Let the sum of squares of the first sample be SS1=70. Let…
Q: Using column (4), is the overall effect of size on price statistically significant? How would you go…
A: Hi! Thank you for the question, As per the honor code, we are allowed to answer three sub-parts at a…
Q: For an acceptable quality level (AQL) of 1%, a lot tolerance proportion defective (LTPD) of 4% and a…
A: Given:-
Q: The performance of two analysts in determining total mercury (mg / kg) in fish was evaluated using…
A: (a). Given, α=1-0.95=0.05 The results on the concentrations of mercury found in fish- Analyst 1…
Q: Brady manages a small airline, and their goal is for 90% of passengers to say they are satis Suppose…
A: When the variable of interest is categorical in nature, it indicates that we are dealing with the…
Q: In general, when people diet they typically lose 10 lbs. (?σ = 2). A random sample of 16 people on…
A: From the given information, the hypothesized mean is 10 lbs and the population standard deviation is…
Q: given normally distributed sample x=12 and s=3, use the Empirical Rule determine the upper and lower…
A: According to the empirical rule,
Q: D. Let us examine Mendel's F2 data for the round/wrinkled and yellow/green dihybrid cross. He…
A:
Q: When computing the Z value to compare between two samples of two populations, o2 is a parameter of…
A: The Formula for z value is : z=Xˉ1−Xˉ2- (μ1-μ2)σ12n1+σ22n2
Q: 4. Using this formula, and the data from the previous problem, what is the value of Cohen's d, and…
A:
Q: Q1 A) List down the measures of central tendency and measures of dispersion 2) The operations…
A: Mean is the average of all the observations. It is defined using the formula x¯=∑xn Variance is the…
Q: A repeated-measures study with n = 26 participants produces a mean difference of MD = 3 points, SS =…
A: Given information n = 26 MD = 3 SS = 500 t = 3.50 df = n – 1 =25
Q: In the one-sample t-test, the SE is the: a)size of the effect b)none of the options c)SD between u…
A: Standard error: Standard error is a measure which explains how accurate are the sample means to…
Q: For a two-sided test of hypothesis of a single parameter with population variance known, for a given…
A: Given,test statistic(Z)=1.8α=0.05Zα2 =1.96And the given test is two tailed test.
Q: For the model Y = Bo + B1X1 + B2X2 + B3X3 + B4X4 + ɛ. When testing Ho: B3 = 0 vs. Hai B3 # 0 at a =…
A: There are 4 independent variables. The dependent variable is Y. We have to test for significance of…
Q: Prior to assessment of the outcome, the researchers did a manipulation check. Members of Groups 1…
A: It is given that the F-test statistic value is 184.29.
Q: Yvon Hopps ran an experiment to determine optimum power and time settings for microwave popcorn.…
A: The following data is given, 2.9, 2.8, 5.2, 6.7, 7.0, 7.8, 10.8, 13.2. n = 8.
Q: From the following test statistic X- Ma Test statistic: T %3D S/ 4 the size of the sample was chosen…
A:
Q: Question 12: Test the claim that the proportion of men who own cats is larger than 50% at the .005…
A:
Q: An independent-measures study comparing two treatment conditions produces a t statistic with df -18.…
A: DF = n1+n2-2 =18 Here n1=n2 = n
Q: In a test of H0:p=0.4 against Ha:p≠0.4, a sample of size 100 produces z=1.28 for the value of the…
A:
Q: For the following, please consider the model Y = α + βX + ε. Using nine observations and OLS; the…
A: Given, the estimated model is, Y^=17.6 + 3.8 X let sample size(n)= 100 1) R 2 = 0.58, F = 5.52, mean…
Q: Two samples, each with n = 9 scores, produce an independent-measures t statistic of t = 2.00. If the…
A: Given information Two samples each with n = 9 scores D.O.F = 9 + 9 – 2 = 16 t = 2
Q: For item d, use the decision below as your reference. The null hypothesis was not rejected, and it…
A: The following information has been given: Null Hypothesis : there is no impact of organic food on…
Q: To display the effects of the X variable on the Y variable in a bivariate table when the independent…
A: According to the provided information, the independent variable has been arranged in the columns.
Q: . The average weight of a Coastal male Grizzly Bear is approximately normal with E(x); =795 pounds…
A: Let X be the random variable from normal distribution with mean E(X) = μ = 795 and standard…
Q: Is sunscreen with an SPF 30 rating more effective at preventing sunburn than sunscreen with an SPF…
A: Denote p15, p30 as the true population proportions of sunburn people who wear SPF 15 and 30…
Q: The model below was fitted to a random sample of 30 families in order to explain household…
A: Given : n = 30 Y = -0.025+0.052X1+1.14X2 SST = 62.1, SSR = 88.2
Q: The purpose of this activity is to compare the proportion of orange colored candy pieces between…
A: Let p1 = proportion of orange-colored candy pieces in the pack of skittles Let p2 = proportion of…
Q: A sample of n = 16 scores produces a t statistic of t = 2.00. If the sample is used to measure…
A: From the given information, n=16 and t=2.00
Q: For the coefficient of an independent variable to be statistically significant and accepted as a…
A: P-value: The probability that sample mean would take a value as extreme or more extreme than…
Q: An investigator wants to estimate caffeine consumption in high school students. How many students…
A: The provided information are:Confidence level = 95% = 0.95So, significance level (alpha) = 1-0.95 =…
Q: The research examining the effects of preschool childcare has found that children who spent time in…
A:
Q: Martin has found a correlation of r = .18 between the two variables of caffeine consumption and…
A: if the size of the sample is large then the critical value would become smaller. A smaller critical…
Q: Using a sample that has n=50 palr of data, we get a correlation coefficient r=-0,269 for the…
A: Given, n = 50 r = -0.269

Step by step
Solved in 2 steps


- The least-squares regression equation is y=784.6x+12,431 where y is the median income and x is the percentage of 25 years and older with at least a bachelor's degree in the region. The scatter diagram indicates a linear relation between the two variables with a correlation coefficient of 0.7962. Predict the median income of a region in which 25% of adults 25 years and older have at least a bachelor's degree.8)Suppose that Y is normal and we have three explanatory unknowns which are also normal, and we have an independent random sample of 11 members of the population, where for each member, the value of Y as well as the values of the three explanatory unknowns were observed. The data is entered into a computer using linear regression software and the output summary tells us that R-square is 0.86, the linear model coefficient of the first explanatory unknown is 7 with standard error estimate 2.5, the coefficient for the second explanatory unknown is 11 with standard error 2, and the coefficient for the third explanatory unknown is 15 with standard error 4. The regression intercept is reported as 28. The sum of squares in regression (SSR) is reported as 86000 and the sum of squared errors (SSE) is 14000. From this information, what is MSE/MST? .5000 NONE OF THE OTHERS .2000 .3000 .4000Suppose the simple linear regression model, Yi = β0 + β1 xi + Ei, is used to explain the relationship between x and y. A random sample of n = 12 values for the explanatory variable (x) was selected and the corresponding values of the response variable (y) were observed. A summary of the statistics is presented in the photo attached. Let b1 denote the least squares estimator of the slope coefficient, β1. What is the value of b1?
- 9)Suppose that Y is normal and we have three explanatory unknowns which are also normal, and we have an independent random sample of 11 members of the population, where for each member, the value of Y as well as the values of the three explanatory unknowns were observed. The data is entered into a computer using linear regression software and the output summary tells us that R-square is 0.79, the linear model coefficient of the first explanatory unknown is 7 with standard error estimate 2.5, the coefficient for the second explanatory unknown is 11 with standard error 2, and the coefficient for the third explanatory unknown is 15 with standard error 4. The regression intercept is reported as 28. The sum of squares in regression (SSR) is reported as 79000 and the sum of squared errors (SSE) is 21000. From this information, what is the adjusted R-square? .8 .7 NONE OF THE OTHERS .6 .5Find the simple regression line y=α+βx for the pairs of points belonging to the independent and dependent variables (xi,yi) , respectively. Also, interpret the result by calculating the Pearson correlation coefficient.Based on a sample on n observations, (x1, y1 ), (x2, y2 ), c, (xn, yn), the sample regression of y on x is calculated. Show that the sample regression line passes through the point (x = x̄, y = ȳ), where x̄ and ȳ are the sample means.
- 17) Suppose that Y is normal and we have three explanatory unknowns which are also normal, and we have an independent random sample of 41 members of the population, where for each member, the value of Y as well as the values of the three explanatory unknowns were observed. The data is entered into a computer using linear regression software and the output summary tells us that R-square is 0.9, the linear model coefficient of the first explanatory unknown is 7 with standard error estimate 2.5, the coefficient for the second explanatory unknown is 11 with standard error 2, and the coefficient for the third explanatory unknown is 15 with standard error 4. The regression intercept is reported as 28. The sum of squares in regression (SSR) is reported as 90000 and the sum of squared errors (SSE) is 10000. From this information, what is the number of degrees of freedom for the t-distribution used to compute critical values for hypothesis tests and confidence intervals for the individual…A multiple regression includes two regressors: Yi = b0 + b1X1i +b2X2i + ui. What is the expected change in Y if X1 increases by 8 unitsand X2 is unchanged? What is the expected change in Y if X2 decreasesby 3 units and X1 is unchanged? What is the expected change in Y if X1increases by 4 units and X2 decreases by 7 units?The least-squares regression line relating two statistical variables is given as = 24 + 5x. Compute the residual if the actual (observed) value for y is 38 when x is 2. 4 38 2
- The least-squares regression equation is y=784.6x+12,431 where y is the median income and x is the percentage of 25 years and older with at least a bachelor's degree in the region. The scatter diagram indicates a linear relation between the two variables with a correlation coefficient of 0.7962. In a particular region, 26.5 percent of adults 25 years and older have at least a bachelor's degree. The median income in this region is $29,889. Is this income higher or lower than what you would expect? Why?For variables x1, x2, x3 and y satisfying the assumptions for multiple linear regression inferences, the population regression equation is y = 27 – 4.7x1 + 2.3x2 + 5.8 x3. For samples of size 20 and given values of the predictor variables, the distribution of the estimates of β1 for all possible sample regression planes is a _________ distribution with mean _________ and standard deviation _______.1. Data was collected on 54 observations on a response of interest, y, and four potential predictor variables x1, x2, x3, and x4. The output from regression analyses of the data is attached to the end of the page. a) For the best subsets regression analysis, which is the best simple linear regression model for predicting y? Briefly explain your criteria for choosing this model. b) For all of the models listed in the best subsets regression analysis, which model is best according to the MSE criterion. c) For all of the models listed in the best subsets regression analysis, which model is best according to the BIC criterion? d) Is the variable from your best simple linear regression model (from part a) included in the model with the lowest overall MSE (part b)? Briefly explain why it could happen that the best single variable is not in the best overall model. e) Following the best subsets regression results, the sums of squares for regression and error (also called residual) are…