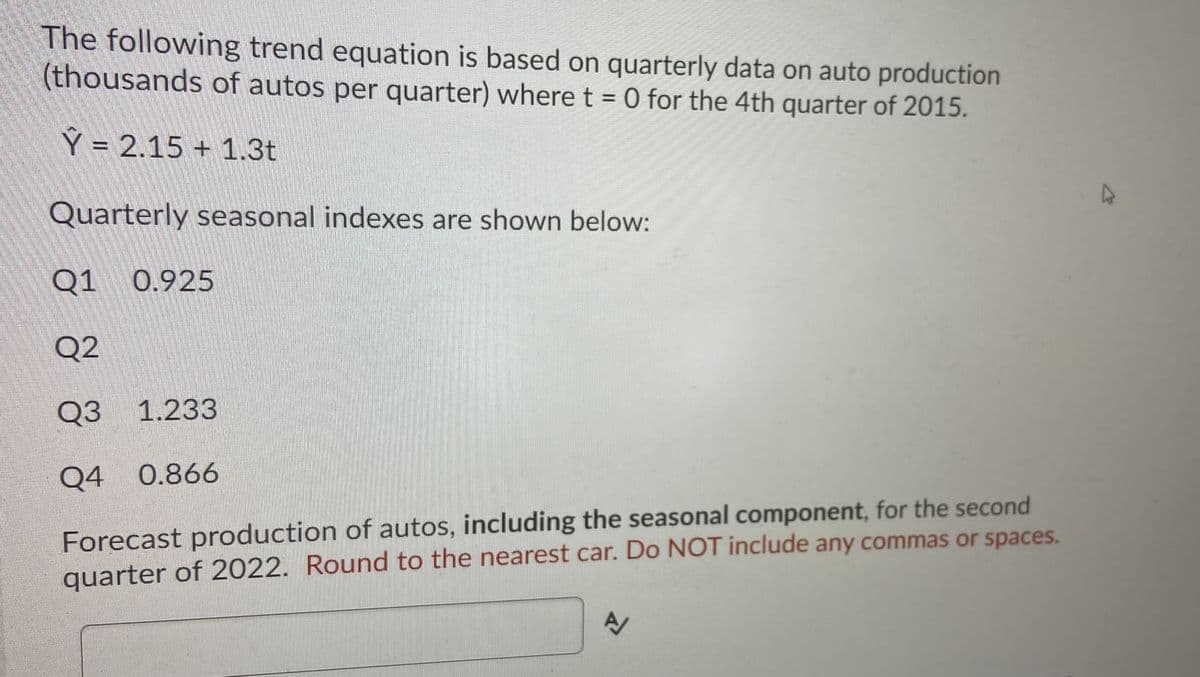
Forecast production of autos, including the seasonal component, for the second quarter of 2022. Round to the nearest car. Do NOT include any commas or spaces.


Q: Consider the following estimated regression equation: y' = 5.2 - 10.3x If (x = 10, y = -100) was one…
A:
Q: s the distribution a discrete probability distribution? Why? Choose the correct answer below. O A.…
A: We have given the statement Distribution is a discrete probability distribution.
Q: A certain AP® Statistics teacher is feeling generous one day and decides that each student deserves…
A: We have given that The probability distribution of Y can be modeled by a uniform density curve on…
Q: Three cards are drawn without replacement from the 12 face cards (jack, queen and king) of an…
A: There are 12 face cards in a deck of 52 cards. That is, Number of kings=4 Number of queens=4 Number…
Q: If n-19, ž(x-bar)=43, and s-8, construct a confidence interval at a 90% confidence level. Assume the…
A:
Q: QUESTION 8 A test of hypotheses is carried out at the X = 0.05 level. The P-value for the applied…
A: Here P value is greater than alpha, so we fail to reject null hypothesis So it is false decision
Q: Find the critical value z, needed to construct a confidence interval with level 80%. Round the…
A: We need to construct a confidence interval with 80%.
Q: A food processing plant fills snack-sized bags of crackers. The mean number of crackers in each bag…
A: We have given that Mean = 22 Standard deviation = 2 Sample size = 24
Q: Illustration 79 Using the method of ordinates fit a normal curve to the following data, 10 -14 15–…
A:
Q: ly correlated with both independent variables and the dependent variable, (2) a variable highly…
A:
Q: Define the unbiased estimators and give estimators including their symbols for each
A: Unbiased Estimator: If the expected value of the estimator calculated from the sample is equal to…
Q: (a) How large a sample must be drawn so that a 99% confidence interval for u will have a margin of…
A:
Q: 4. A company produces an electric toothbrush with a life (that time period for which it does not…
A:
Q: You have 6 tiny cheapo generators powering your house. If at least 4 out of the 6 generators are…
A:
Q: In a random sample of 254 moviegoers, it was found that 117 of them regularly buy popcorn. Use a…
A: We have given that n = 253 x = 117 α = 0.14 p = 50% = 0.50
Q: Twelve second-year medical students at a local hospital measured the systolic blood pressure of the…
A: Given: n = 12 second-year medical students α = 0.05 μ=140
Q: Heights for group of people are normally distributed with mean = 66 inches and standard deviation =…
A: Given that mu = 66 , s.d =3.9
Q: Find the value of so that the area to the left of is 0.0847. b. Find the value of so…
A:
Q: he workers' union at a certain university is quite strong. About 96 % of all workers employed by the…
A: Let X be the random variable from binomial distribution with probability (p) = 96% = 0.96 and sample…
Q: A newsletter publisher believes that less than 65 % of their readers own a Rolls Royce. For…
A: From the provided information, A newsletter publisher believes that less than 65% of their readers…
Q: The formulas for computing the intercept and slope for a least squares simple regression equation…
A: Given: Regression model Yi=b0+b1*xi+ei To estimate the value of intercept and slope of the model…
Q: . Define the moment generating function of a random variable and state its properties,
A:
Q: A car battery manufacturer claims that its car batteries last at least 4 years on average, under…
A: Given that Sample size n =72 Sample mean =3.86 Population standard deviation =0.58
Q: What is the purpose for post tests? a. to determine whether or not a Type I error was committed…
A: We know that- In many treatments after testing, we just know that there is a difference between the…
Q: Hand written please. Suppose that in a population of surveyors in a certain area 38% have surveyed…
A: Given that n=900 , p=38% Find the P(phat>0.35)
Q: For each situation, state the null and alternative hypotheses: (Type "mu" for the symbol u, e.g. mu…
A: Given that A) Sample mean=6.39 Population mean=6.5 Population Standard deviation=0.18 Sample…
Q: A statistician chooses 27 randomly selected dates, and when examining the occupancy records of a…
A: In question, We have given sample size of 27 with sample standard deviation of 5.86 then we'll find…
Q: quick quiz consists of a true/false question followed by a true/false question. If both questions…
A:
Q: In a criminal trial where the null hypothesis is innocence, a Type I error is made when: A. a guilty…
A:
Q: The Consumer Reports National Resnarch Centbre conducled a survey of 1100 adults to leam about their…
A: Solution
Q: In each of the following cases, find the best predicted value for y given that x = 3.00. The given…
A: We have given that the regression line y^ = 6.00 + 3.00x Here, need to find out the best predicted…
Q: You are heading to the LLN Casino and plan to play their world famous slot machine. The slot machine…
A: Each spin results in a "skull" (i.e., success) or "not in a skull" (i.e., failure), and the given…
Q: People who sustain a concussion or a traumatic brain injury (TBI) are likely to experience sleep…
A: Given: People who sustain a concussion or a traumatic brain injury (TBI) are likely to experience…
Q: 0.1- 0.05+ 110 120 130 140 Minutes 3. f(x) T 0.15- 0.1- 0.05- 110 120 130 140 Minutes Select your…
A: Note: According to Bartleby expert guidelines, we can answer only first question with their three…
Q: Find the probability of this event. A random spinner has equal sized regions numbered 1-18. The…
A:
Q: . A survey was conducted to 100 students to determine how much time they spend for studying before…
A: From the given data, there are 100 students studying before taking a major examination. Sample…
Q: 98. A 95% confidence interval for the mean price of textbooks at UCLA in the spring quarter of 2010,…
A:
Q: For a confidence level of 77%, what is the area in the right tail region? a. 0.057 O b. 0.23 О с.…
A:
Q: Commute Time to Work The average commute to work (one way) is 25 minutes according to the 2005…
A:
Q: A forest technician measures the height and volume of usable lumber of a sample of trees to try to…
A:
Q: According to the Census Bureau, approximately 5.3% of Americans have French heritage. You believe it…
A: The random variable having French heritage follows normal distribution. We have to test whether the…
Q: You measured the diameter of several Oreos. Their diameters in mm are 45.00 | 45.20 45.10 | 44.90…
A:
Q: Given that the 84% confidence interval for the waiting time (in minutes) of emergency room patients…
A: Point estimate =? Margin of error =?
Q: Compute the probabilities and fit a posson distribution for the following data No. of accidents :…
A:
Q: Please answer the following multiple choice questions :) (these are all part of one question)…
A:
Q: In 2001, the polls found that 81% of American adults believed that there was a conspiracy in the…
A: Given that Sample size n =1160 Favorable cases x =897 Sample proportion p^=x/n =897/1160 =0.7733
Q: Find the probability that a randomly selected person was a crew member or did not survive.…
A: The union probability for any two events A and B is defined as P(A or B) = P(A) + P(B) – P(A and…
Q: Calculate the p-value for each of the given hypothesis test scenarios below. Round p-values to four…
A: Here we have to calculate the p-value for each of the following case
Q: Under what conditions can the mean of the sample be treated as a value that is from a population…
A: From the above data under what conditions can the mean of the sample be treated as a value that is…
Q: Last week Sarah had exams in Math and in Spanish. She had relatively speaking? Score of 45 on the…
A: Given that. X~N( μ , ?^2 ) Z-score =( x - μ )/?
22

Step by step
Solved in 2 steps

- Table 6 shows the population, in thousands, of harbor seals in the Wadden Sea over the years 1997 to 2012. a. Let x represent time in years starting with x=0 for the year 1997. Let y represent the number of seals in thousands. Use logistic regression to fit a model to these data. b. Use the model to predict the seal population for the year 2020. c. To the nearest whole number, what is the limiting value of this model?bThe average rate of change of the linear function f(x)=3x+5 between any two points is ________.The US. import of wine (in hectoliters) for several years is given in Table 5. Determine whether the trend appearslinear. Ifso, and assuming the trend continues, in what year will imports exceed 12,000 hectoliters?
- The following equation summarizes the trend portion of quarterly sales of condominiums over a long cycle. Sales also exhibit seasonal variations. Using the information given, prepare a forecast of sales for each quarter of next year (not this year), and the first quarter of the year following that. Ft = 30 – 5.5t + 2.5t2 Where Ft = Unit Sales t = 0 at, the first quarter of this year Quarter Relative 1 1.1 2 1.0 3 0.7 4 1.2The trendline is given for enrollment at a local college, with data from 1992-2011, where x is the year and y is the enrollment. Y= 178.09x -353194 Should we use this model to predict enrollment in 2025?The following scatter plot represents population growth at a new school starting in 2021. (Graph is attached).Using the trendline, predict the population for the school in 2030.
- The percentage of mothers who smoke cigarettes during pregnancy has declined approximately linearly from13.1% in 1997 to 12.3% in 2004 Predict the percentage in 2015.The median home value in Mississippi and Maryland (adjusted for inflation) are shown below: If we assume that the house values are changing linearly,a) In which state have home values increased at a higher rate? b) If these trends were to continue, what would be the median home value in Mississippi in 2010?$Week (X) Demand (Y) 1 2000 2 2200 3 1890 4 2248 5 1902 6 2300 7 2304 8 1903 9 1899 10 2180 11 1893 12 1201 13 1000 how do I insert a linear trendline and be sure to display the equation and R value in excel?
- hudson Marine has been an authorized dealer for c&d marine radios for the past sevenyears. the following table reports the number of radios sold each year.Year 1 2 3 4 5 6 7Number Sold 35 50 75 90 105 110 130a. construct a time series plot. does a linear trend appear to be present?b. Using Minitab or excel, develop a linear trend equation for this time series.c. Use the linear trend equation developed in part (b) to develop a forecast for annualsales in year 8.The picture shows that the estimation of the model with quarterly car sales in the U.S. from 1975 to 1990. Based on the parameter estimates, what is the predicted effect of a 10% increase in price on the number of cars sold? What would be the effect of that price increase on the value of car sales?Consider the following regression equation representing the linear relationship between the Canada Child Benefit provided for a married couple with 3 children under the age of 6, based on their annual family net income: ŷ =121.09−0.57246xR2=0.894 where y = annual Canada Child Benefit paid (in $100s) x = net annual family income (in $1000s) Source: Canada Revenue Agency a. As the net annual family income increases, does the Canada Child Benefit paid increase or decrease? Based on this, is the correlation between the two variables positive or negative?The Canada Child Benefit paid .The correlation between the two variables is .b. Calculate the correlation coefficient and determine if the relationship between the two variables is strong, moderate or weak.r= , the relationship is . Round to 3 decimal places c. Interpret the value of the slope as it relates to this relationship. For every $1 increase in annual family net income, there is a $0.57246 decrease in…
