Formulate a frequency distribution table and Draw a Bar diagram and Histogram from the given data from the data set- 25,28,12, 35,37,22,16,29,34,39,35,49,36,23,29,65,69,56,51,20 62,71,73,15,17,42,78,73,36,45,50,59,63,67,29,24,16,50,60,50
Formulate a frequency distribution table and Draw a Bar diagram and Histogram from the given data from the data set- 25,28,12, 35,37,22,16,29,34,39,35,49,36,23,29,65,69,56,51,20 62,71,73,15,17,42,78,73,36,45,50,59,63,67,29,24,16,50,60,50

Glencoe Algebra 1, Student Edition, 9780079039897, 0079039898, 2018
18th Edition
ISBN:9780079039897
Author:Carter
Publisher:Carter
Chapter10: Statistics
Section10.6: Summarizing Categorical Data
Problem 4BGP

Related questions
Question
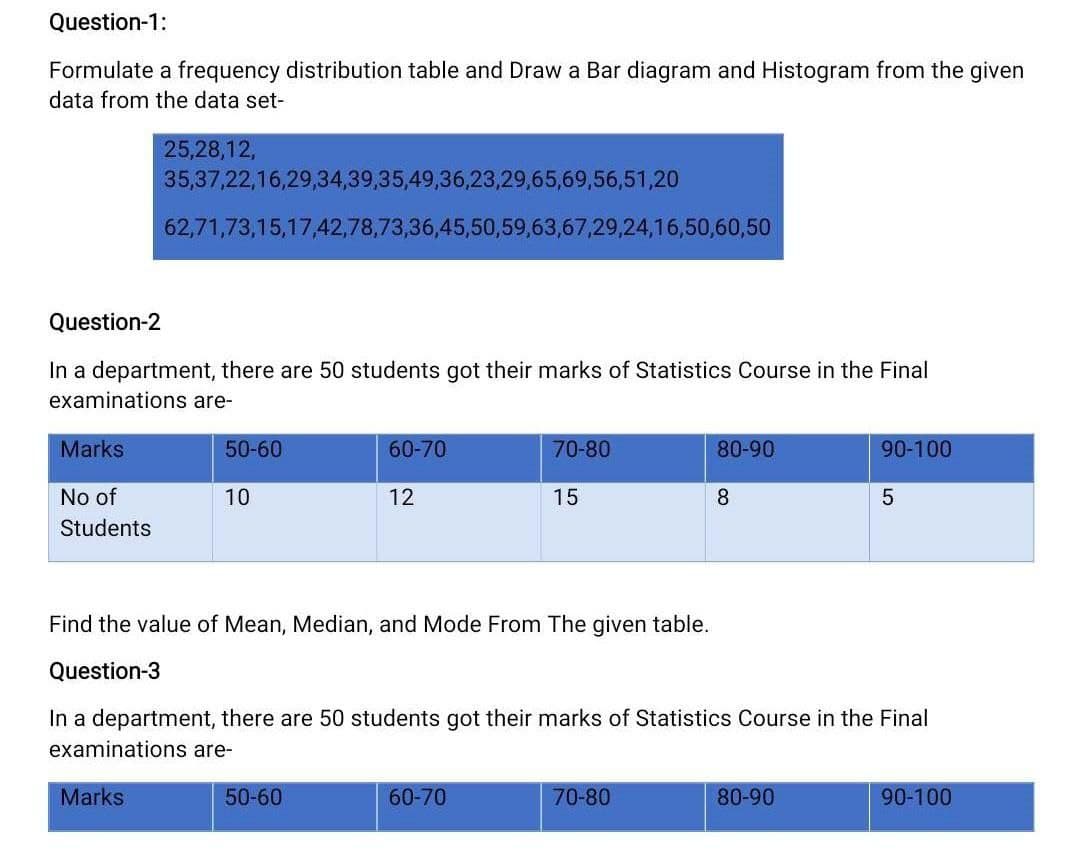
Transcribed Image Text:Question-1:
Formulate a frequency distribution table and Draw a Bar diagram and Histogram from the given
data from the data set-
25,28,12,
35,37,22,16,29,34,39,35,49,36,23,29,65,69,56,51,20
62,71,73,15,17,42,78,73,36,45,50,59,63,67,29,24,16,50,60,50
Question-2
In a department, there are 50 students got their marks of Statistics Course in the Final
examinations are-
Marks
50-60
60-70
70-80
80-90
90-100
No of
10
12
15
8.
5
Students
Find the value of Mean, Median, and Mode From The given table.
Question-3
In a department, there are 50 students got their marks of Statistics Course in the Final
examinations are-
Marks
50-60
60-70
70-80
80-90
90-100
Expert Solution
This question has been solved!
Explore an expertly crafted, step-by-step solution for a thorough understanding of key concepts.

Step by step
Solved in 2 steps with 2 images

Recommended textbooks for you
Glencoe Algebra 1, Student Edition, 9780079039897…
Algebra
ISBN:
9780079039897
Author:
Carter
Publisher:
McGraw Hill

Holt Mcdougal Larson Pre-algebra: Student Edition…
Algebra
ISBN:
9780547587776
Author:
HOLT MCDOUGAL
Publisher:
HOLT MCDOUGAL
Glencoe Algebra 1, Student Edition, 9780079039897…
Algebra
ISBN:
9780079039897
Author:
Carter
Publisher:
McGraw Hill
Holt Mcdougal Larson Pre-algebra: Student Edition…
Algebra
ISBN:
9780547587776
Author:
HOLT MCDOUGAL
Publisher:
HOLT MCDOUGAL