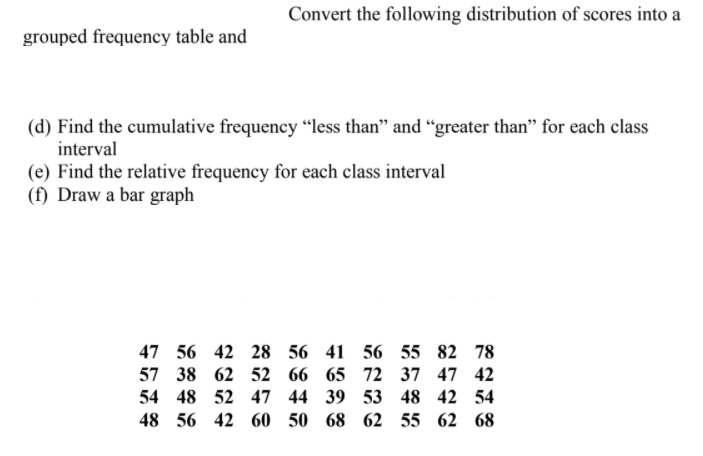
Convert the following distribution of scores into a grouped frequency table and (d) Find the cumulative frequency “less than" and “greater than" for each class interval (e) Find the relative frequency for each class interval (f) Draw a bar graph 47 56 42 28 56 41 56 55 82 78 57 38 62 52 66 65 72 37 47 42 54 48 52 47 44 39 53 48 42 54 48 56 42 60 50 68 62 55 62 68


Inverse Normal Distribution
The method used for finding the corresponding z-critical value in a normal distribution using the known probability is said to be an inverse normal distribution. The inverse normal distribution is a continuous probability distribution with a family of two parameters.
Mean, Median, Mode
It is a descriptive summary of a data set. It can be defined by using some of the measures. The central tendencies do not provide information regarding individual data from the dataset. However, they give a summary of the data set. The central tendency or measure of central tendency is a central or typical value for a probability distribution.
Z-Scores
A z-score is a unit of measurement used in statistics to describe the position of a raw score in terms of its distance from the mean, measured with reference to standard deviation from the mean. Z-scores are useful in statistics because they allow comparison between two scores that belong to different normal distributions.

Step by step
Solved in 4 steps with 1 images


