frequency distribution of weight in kilograms of selected adults of a barangay is the following: ample - grouped data) 40 40 43 46 44 49 51 54 46 51 47 49 49 45 45 44 45 41 49 52 51 54 50 51 41 52 53 50 46 56 42 42 40 42 49 47 51 48 46 57
frequency distribution of weight in kilograms of selected adults of a barangay is the following: ample - grouped data) 40 40 43 46 44 49 51 54 46 51 47 49 49 45 45 44 45 41 49 52 51 54 50 51 41 52 53 50 46 56 42 42 40 42 49 47 51 48 46 57

Glencoe Algebra 1, Student Edition, 9780079039897, 0079039898, 2018
18th Edition
ISBN:9780079039897
Author:Carter
Publisher:Carter
Chapter10: Statistics
Section10.4: Distributions Of Data
Problem 19PFA

Related questions
Question
100%
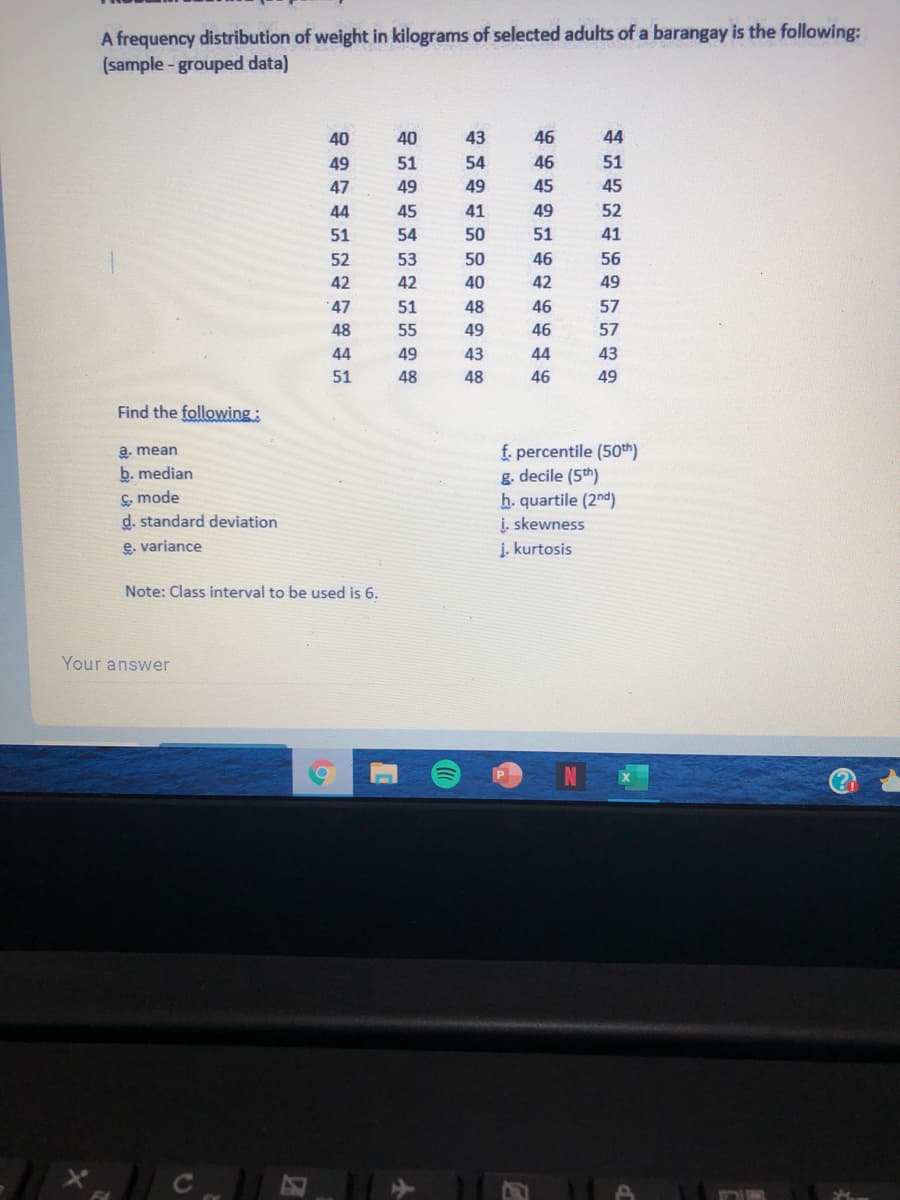
Transcribed Image Text:A frequency distribution of weight in kilograms of selected adults of a barangay is the following:
(sample - grouped data)
40
40
43
46
44
49
51
54
46
51
47
49
49
45
45
44
45
41
49
52
51
54
50
51
41
52
53
50
46
56
42
42
40
42
49
47
51
48
46
57
48
55
49
46
57
44
49
43
44
43
51
48
48
46
49
Find the following:
f. percentile (50th)
g. decile (5th)
h. quartile (2nd)
į. skewness
į. kurtosis
a. mean
b. median
& mode
d. standard deviation
e. variance
Note: Class interval to be used is 6.
Your answer
Expert Solution
This question has been solved!
Explore an expertly crafted, step-by-step solution for a thorough understanding of key concepts.

Step by step
Solved in 5 steps with 5 images

Recommended textbooks for you
Glencoe Algebra 1, Student Edition, 9780079039897…
Algebra
ISBN:
9780079039897
Author:
Carter
Publisher:
McGraw Hill
Glencoe Algebra 1, Student Edition, 9780079039897…
Algebra
ISBN:
9780079039897
Author:
Carter
Publisher:
McGraw Hill