Frequency distribution please help

Glencoe Algebra 1, Student Edition, 9780079039897, 0079039898, 2018
18th Edition
ISBN:9780079039897
Author:Carter
Publisher:Carter
Chapter10: Statistics
Section: Chapter Questions
Problem 25SGR

Related questions
Question
Frequency distribution please help
Transcribed Image Text:Frequency
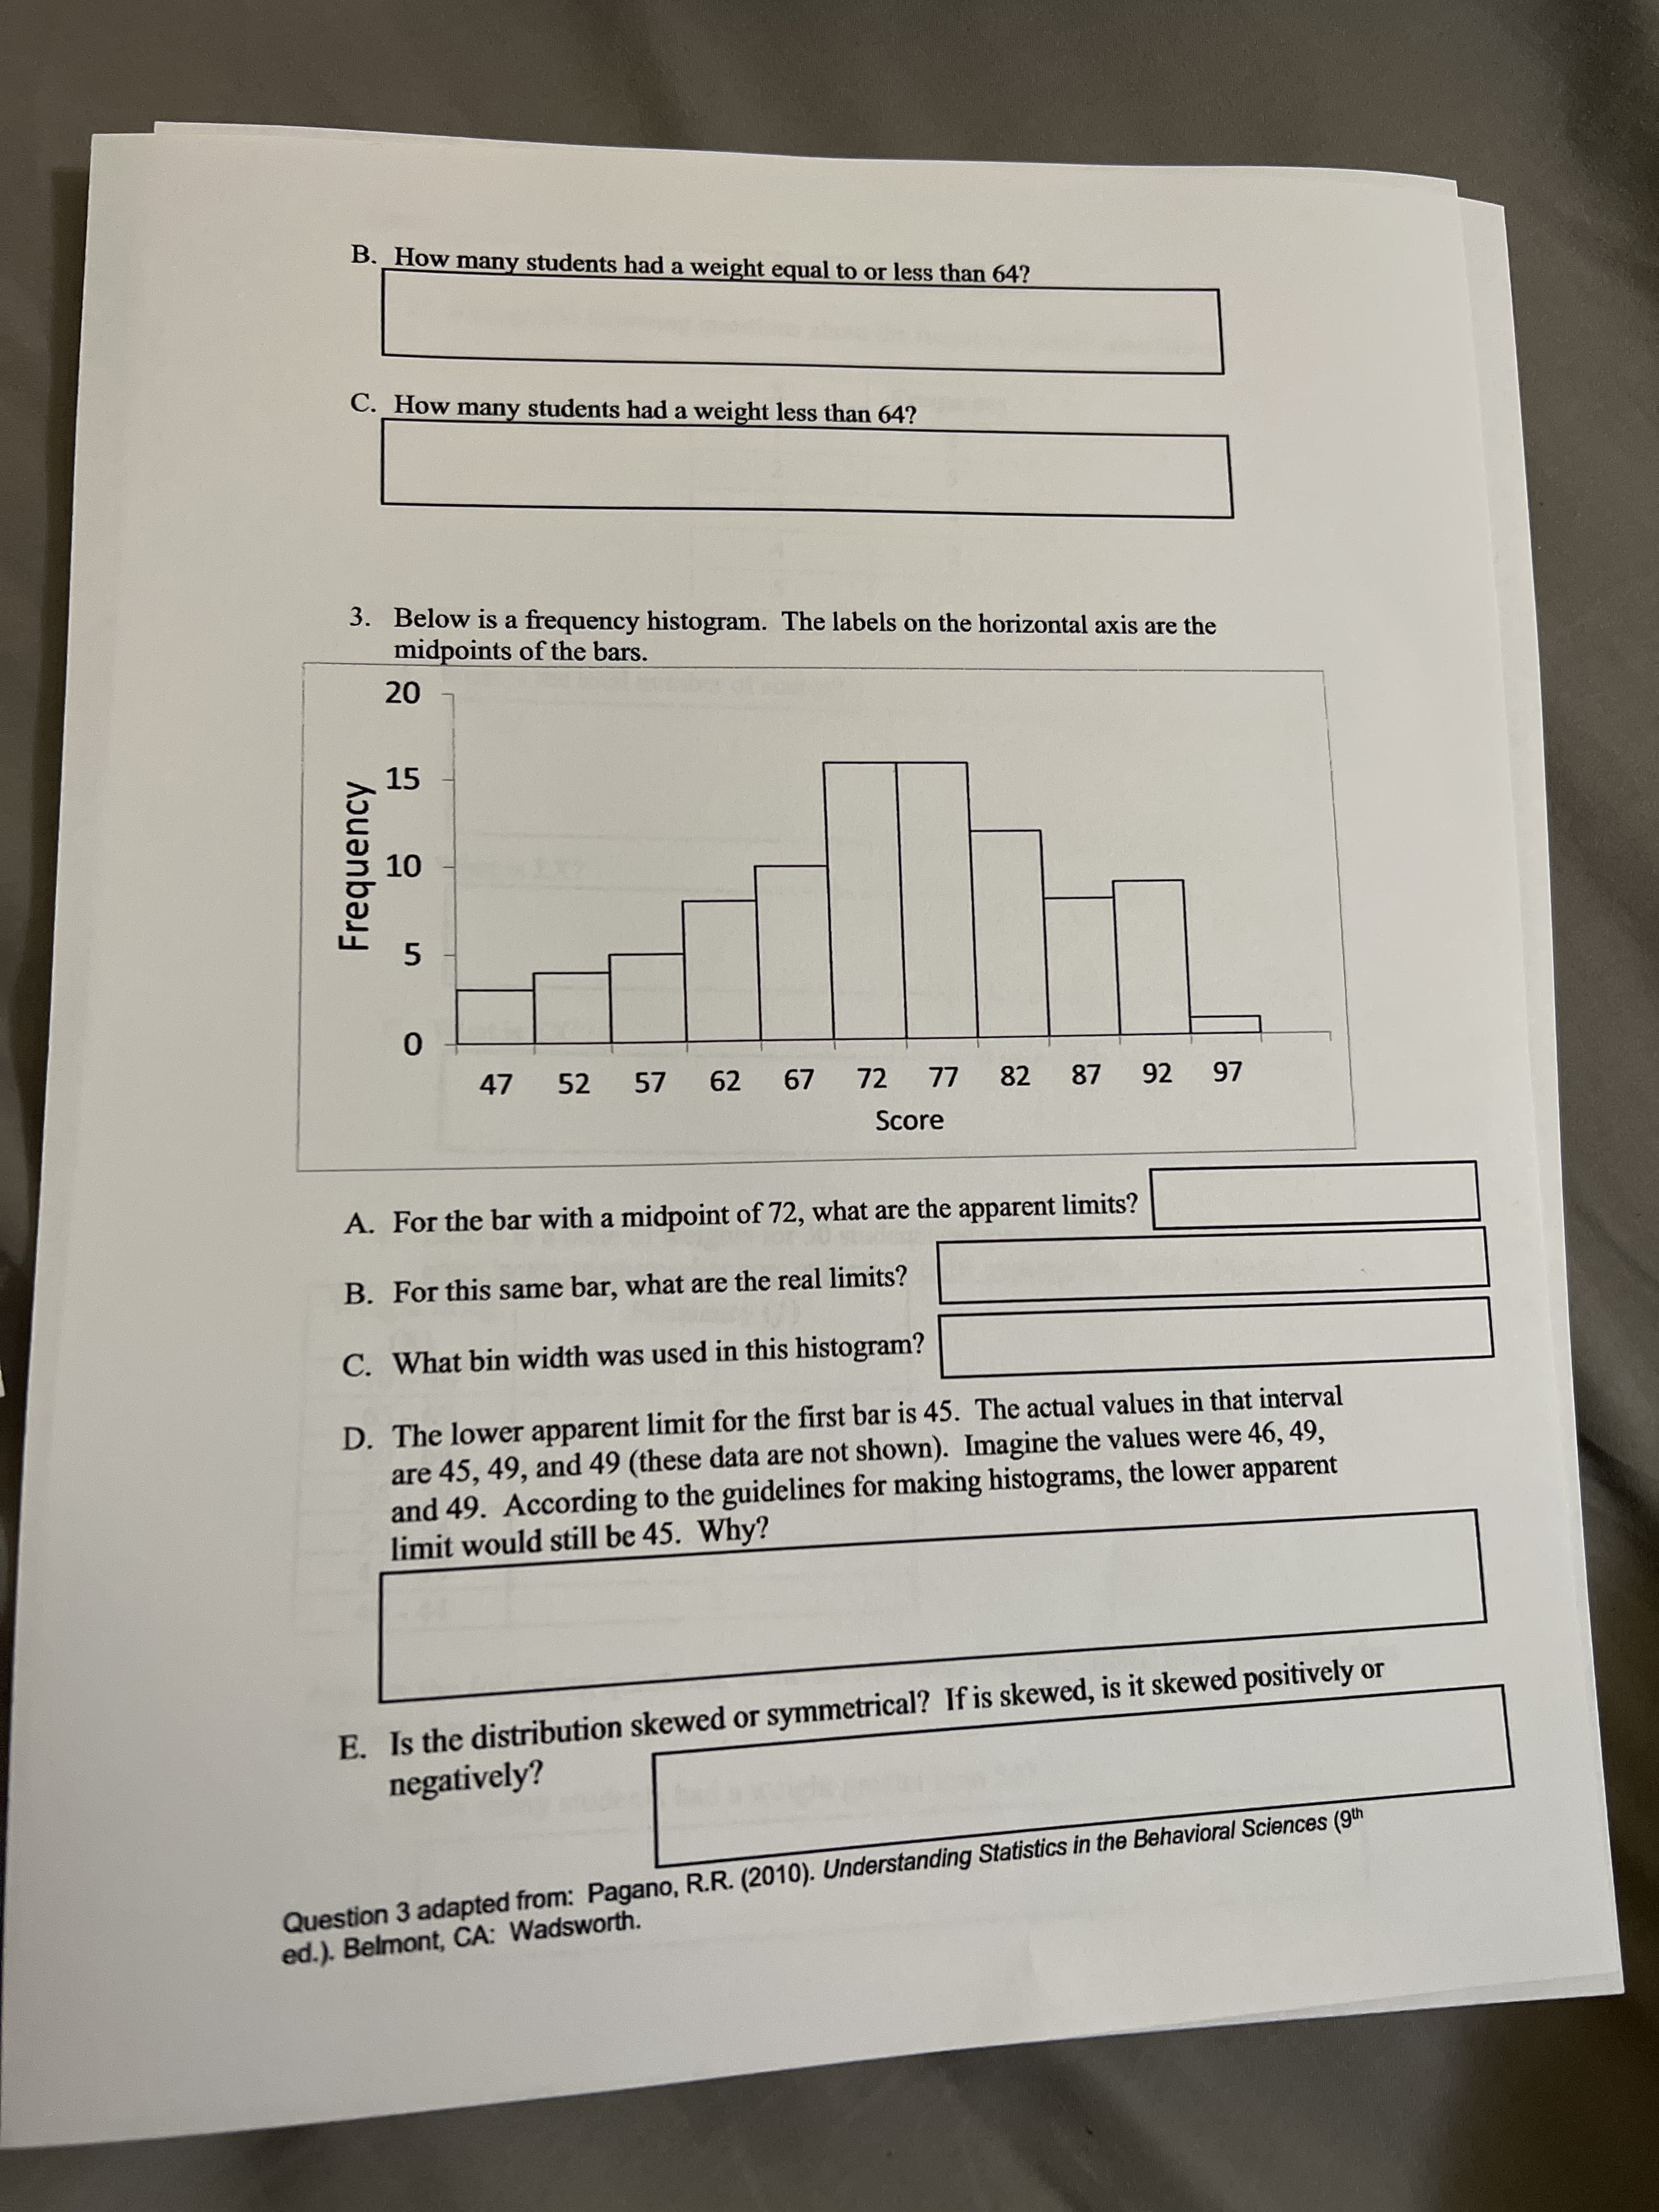
B. _How many students had a weight equal to or less than 64?
C. How many students had a weight less than 64?
3. Below is a frequency histogram. The labels on the horizontal axis are the
midpoints of the bars.
15
5.
47
52
57
62
72
82
LL
Score
87
92
97
A. For the bar with a midpoint of 72, what are the apparent limits?
B. For this same bar, what are the real limits?
C. What bin width was used in this histogram?
D. The lower apparent limit for the first bar is 45. The actual values in that interval
are 45, 49, and 49 (these data are not shown). Imagine the values were 46, 49,
and 49. According to the guidelines for making histograms, the lower apparent
limit would still be 45. Why?
E. Is the distribution skewed or symmetrical? If is skewed, is it skewed positively or
negatively?
Question 3 adapted from: Pagano, R.R. (2010). Understanding Statistics in the Behavioral Sciences (9th
ed.). Belmont, CA: Wadsworth.
Transcribed Image Text:S85
Name
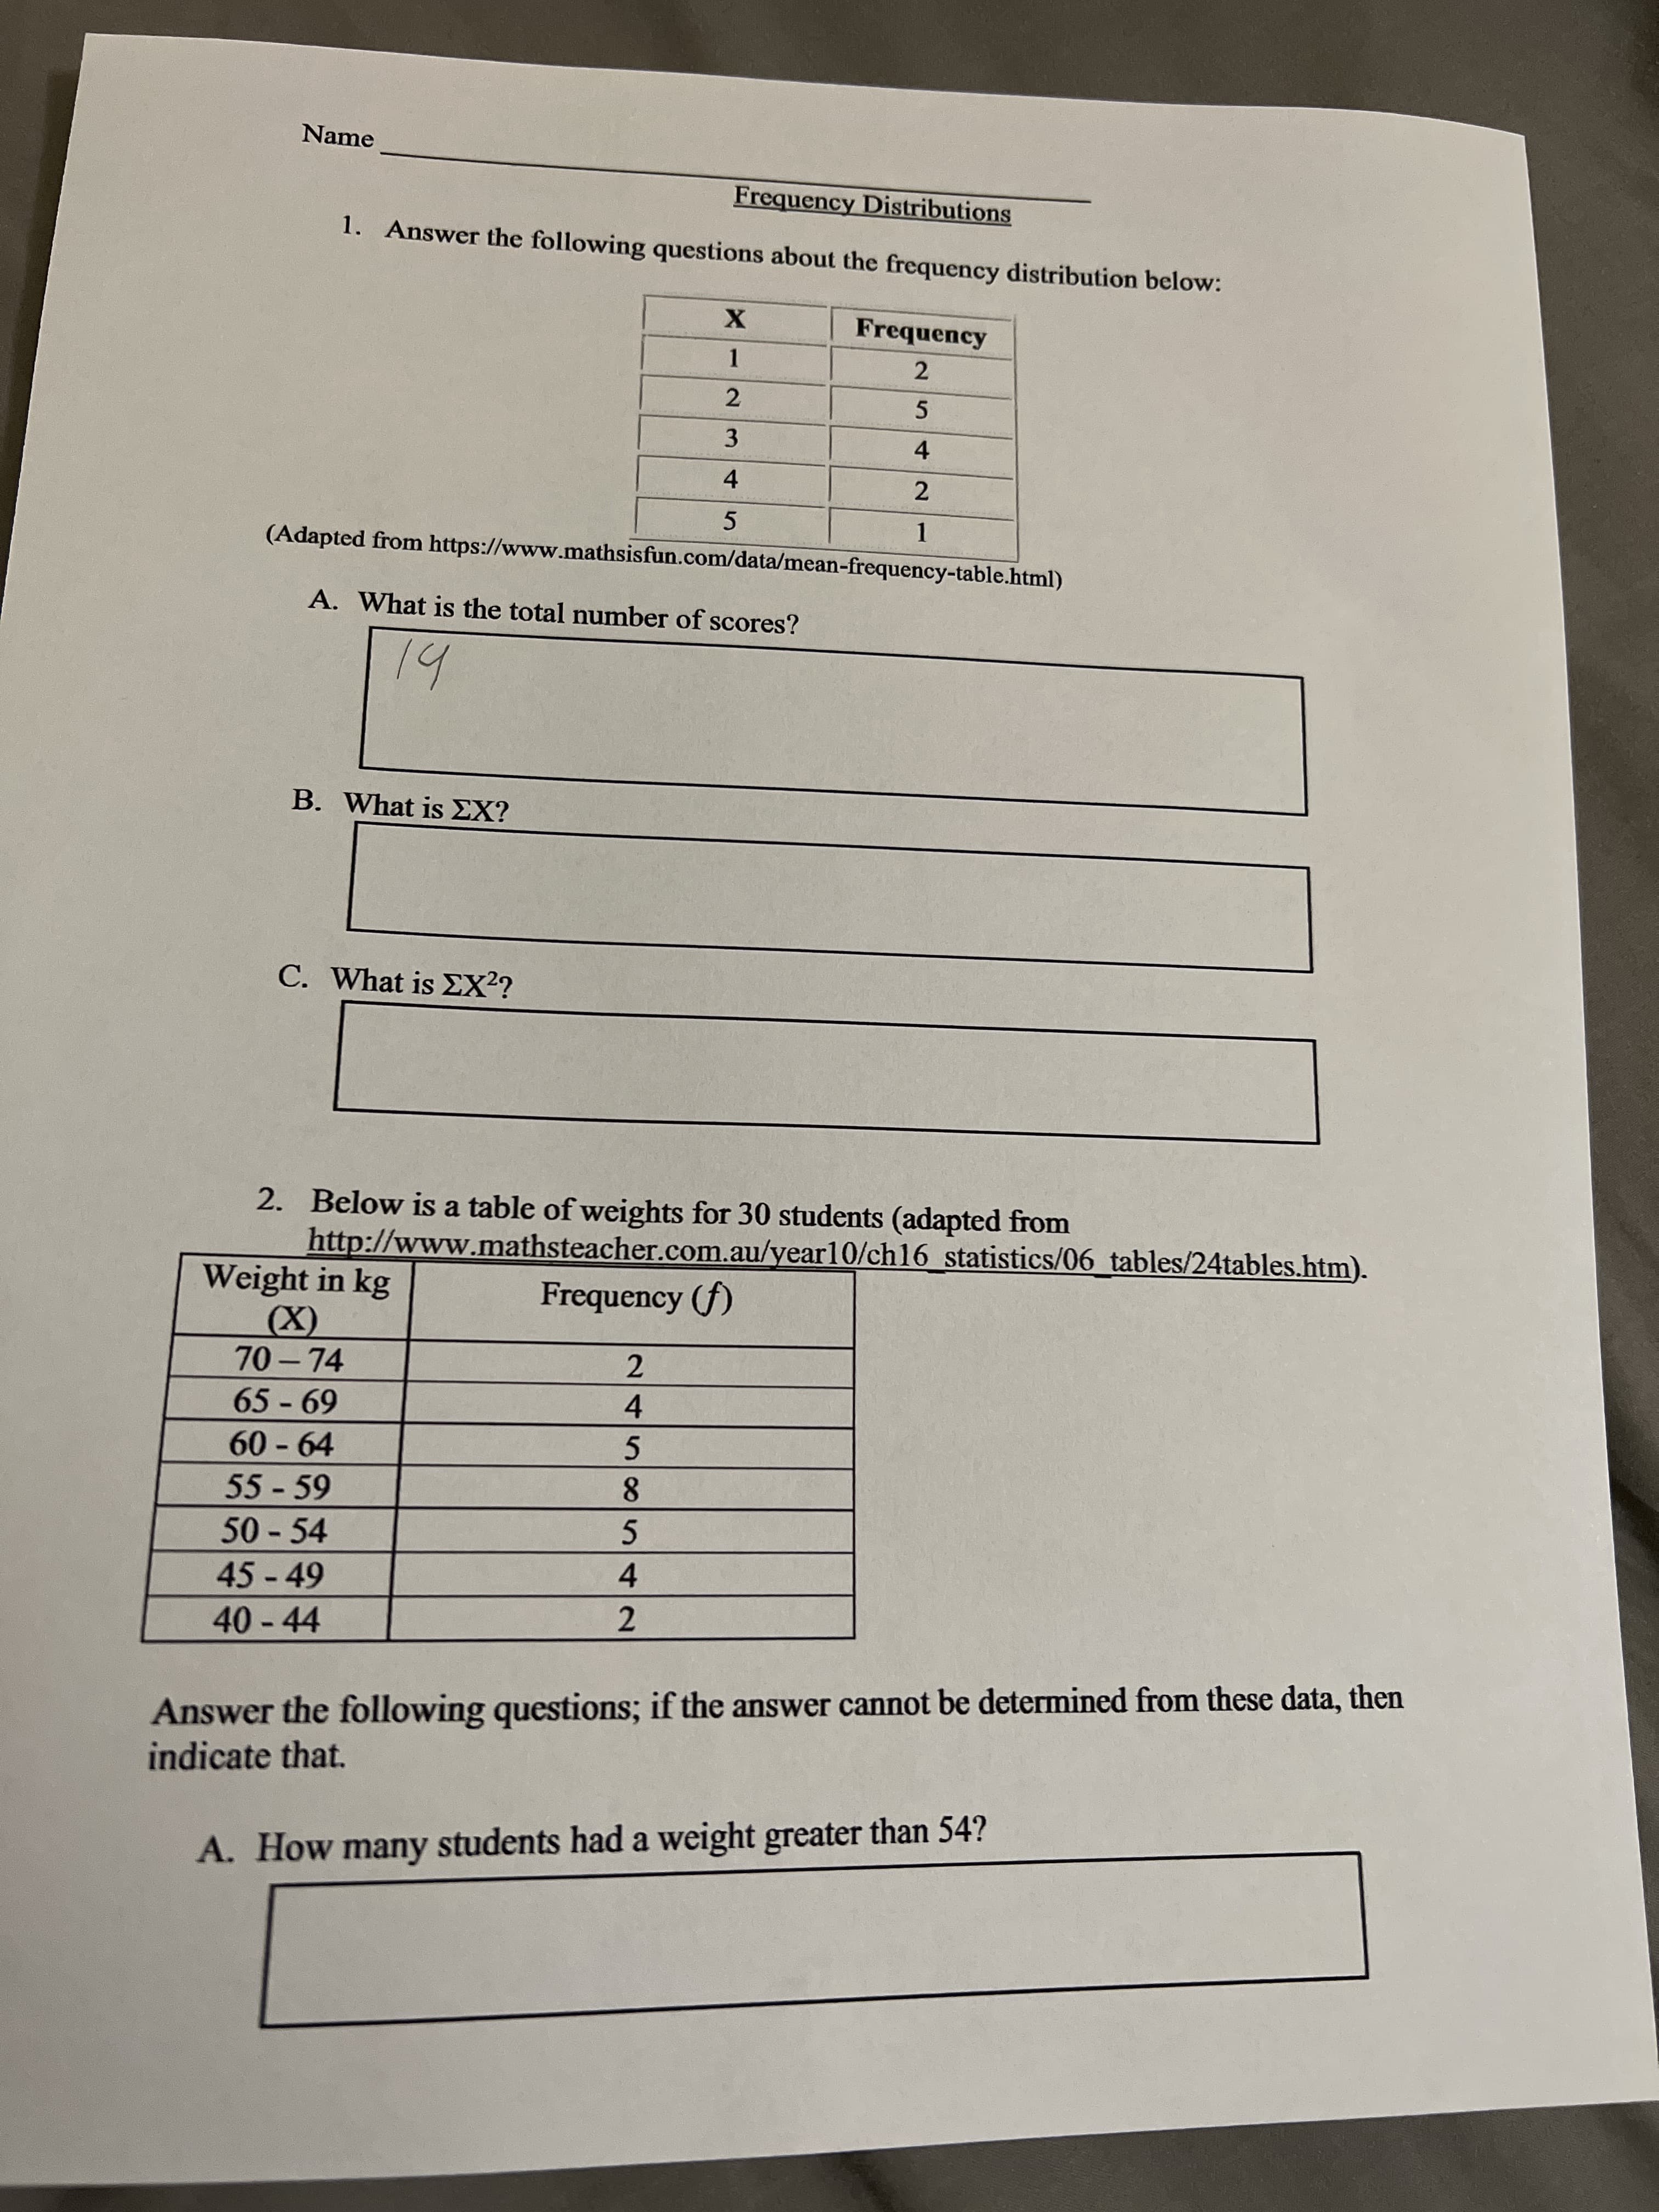
Frequency Distributions
1. Answer the following questions about the frequency distribution below:
Frequency
2.
2
4.
2.
(Adapted from https://www.mathsisfun.com/data/mean-frequency-table.html)
1.
A. What is the total number of scores?
14
B. What is EX?
C. What is EX?
2. Below is a table of weights for 30 students (adapted from
http://www.mathsteacher.com.au/year10/ch16 statistics/06 tables/24tables.htm).
Weight in kg
Frequency (f)
(X)
70 - 74
2
65-69
4.
60-64
55-59
50 - 54
45-49
4.
40 -44
2.
Answer the following questions; if the answer cannot be determined from these data, then
indicate that.
A. How many students had a weight greater than 54?
Expert Solution
This question has been solved!
Explore an expertly crafted, step-by-step solution for a thorough understanding of key concepts.

Step by step
Solved in 4 steps

Recommended textbooks for you
Glencoe Algebra 1, Student Edition, 9780079039897…
Algebra
ISBN:
9780079039897
Author:
Carter
Publisher:
McGraw Hill
Glencoe Algebra 1, Student Edition, 9780079039897…
Algebra
ISBN:
9780079039897
Author:
Carter
Publisher:
McGraw Hill