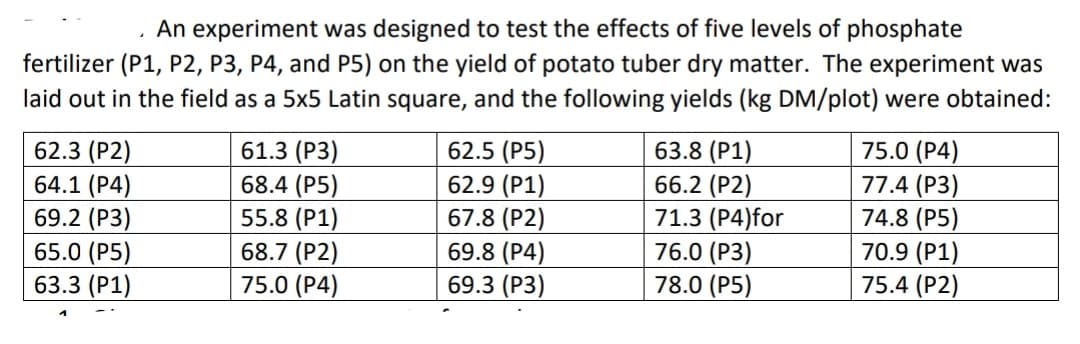
Obtain the descriptive statistics for each type of fertilizer.


Q: 1. Determine sufficient statistics in the case of a random sample of size n from the uniform (a)…
A:
Q: How does the cost of shipping a standard-sized crate relate to the distance of the destination? Can…
A:
Q: Table #7.3.7 contains pulse rates after running for 1 minute, collected from females who drink…
A: The random variable pulse rate follows normal distribution. We have to test whether the mean pulse…
Q: e amount of pollutants that are found in waterways near large cities is normally distributed with…
A: Givan: Mean =9.5 Standard deviation =1.7 n=37
Q: ACTIVITY Formulate a Null Hypothesis and Alternative Hypothesis for each of the following and write…
A: Since you have posted a question with multiple subparts, we will solve first three subparts for you.…
Q: Sample Situation 1. Richard's target population for his study is the employees of hotels in Bataan.…
A:
Q: Calculate the relative frequency P(E).
A: there are total 500 novel , n(U ) = 500 no of book read by you no of novel you read= n(Y) = 150 no…
Q: 1. Consider the population consisting of the values (1, 3, 8). a. List all the possible samples of…
A: The given population is (1, 3, 8). We have to create possible samples of size 2 with replacement and…
Q: The time spent waiting in the line is approximately normally distributed. The mean waiting time is…
A:
Q: It is desired to obtain a 95% confidence interval for the mean time µ= 120 minutes to take the…
A:
Q: A fitness center is interested in finding a 99% confidence interval for the mean number of days per…
A: The random variable number of visits follows normal distribution. We have to construct 99%…
Q: data: 1 1 2 3 4 4 4 8 9 10 solve for: a. 1st quartile b. 3rd decile c. 35th percentile…
A:
Q: 1. How does the cost of shipping a standard-sized crate relate to the distance of the destination?…
A:
Q: In order to see which brand of golf balls is best (as measured by distance travelled), an experiment…
A: In the given problem we have given that three groups and respectively those are, 1. Callaway 2. Nike…
Q: In 1999, the average percentage of women who received prenatal care per country was 80.1%. The table…
A:
Q: 20. What is the value of SSy? (SHOW YOUR WORK)
A: For the given data ( 20 ) SSY = ?
Q: IELTS mock examination for many years. Below is the summary presented by the tutorial school related…
A:
Q: Population Positive Covid 19 No Name density/Km2 Day 1 Day 2 Day 3 Day 4 Day 5 Day 6 Day 7 Day 8 Day…
A: First we enter the given data set in Excel file. Add all the day's values and create a new column…
Q: In each problem show all steps of the hypothesis test using PHANTOMS. If some of the assumptions…
A: Given: Sr. No. Data (x) 1 1.36 2 1.42 3 5.93 4 5.36 5 0.06 6 9.11 7 7.32 8…
Q: () There is a 5% chance that the mean reading speed of a random sample of 20 second grade students…
A: Note: Hi! Thank you for the question. As you have specifically asked for help with part f, we have…
Q: Iranian researchers studied factors affecting patients' likelihood of wearing orthodontic…
A: For the given data Find a) Calculate the numerator for the F statistic (i.e., between-groups…
Q: If a random sample of size 17 is taken from a normal population, find a. to.05 b. -to.01 c. P(T >…
A: Since you have posted a question with multiple sub-parts, we will solve first three subparts for…
Q: Design and Analysis of Experiment using the statistical technique one-way Anova. Use Minitab…
A:
Q: (1) Two rubber compounds were tested for tensile strength and the fol- lowing values were found A :…
A:
Q: 2. What is common, recurring, or involved in all three problems?
A: A percentile is a statistical measure used to express the percentage of observations falling below…
Q: 16. If the Pearson Correlation Coefficient that you calculated in #9 remains the same, but you had 4…
A: Using the given data ( 16 ) Make the decision
Q: What is the null hypothesis? What is the alternative hypothesis? What is my total df?…
A: Since, we answer up to three subparts of a problem, we'll be answering the first three subparts.…
Q: The math test scores of 20 UPN students are as follows: 9, 5, 3,10, 3, 8, 4, 7, 7, 5, 4, 8, 9, 7, 9,…
A: We have given data are 9, 5, 3,10, 3, 8, 4, 7, 7, 5, 4, 8, 9, 7, 9, 10, 10, 4, 1, 10
Q: DETERMINE THE MEAN, VARIANCE, AND STANDARD DEVIATION OF THE FOLLOWING PROBABILITY DISTRIBUTION AND…
A: a. The formula for mean is defined as µ = Σ[xP(x)].
Q: Test the hypothesis using the P-value approach. Be sure to verify the requirements of the test. Ho:…
A:
Q: You are conducting a multinomial hypothesis test (αα = 0.05) for the claim that all 5 categories are…
A: The objective is to test the claim at 5% level of significance that 5 categories are equally likely…
Q: Suppose a random sample of 50 basketball players have an average height of 78 inches. Also assume…
A: Note: According to Bartleby expert guidelines, we can answer only first question with their three…
Q: good working condition by satisfaction level. A numerical rating of 5 is assigned to very satisfied…
A: Given information: No. of articles=03 In 1st article, Sample size (x1)=50 In 2nd article, Sample…
Q: Suppose a researcher is testing the hypothesis Hn: p=0.6 versus H,: p<0.6 and she finds the P-value…
A: The random variable X follows normal distribution. We have to test whether the population proportion…
Q: M2 W3 L3 E1 (Schoology) 1 of 7 O 00:15/20:00 田 17 12 -0.25
A: The following information has been provided: The sample mean is X¯=17 The sample standard deviation…
Q: Suppose that the time students wait for a bus can be described by a uniform random variable X, where…
A: X~ U (15 ,55 ) Find ( a ) P ( 15<X<25 ) =? ( B ) p ( x>=25 ) =?
Q: The following is a set of hypotheses, some information from one or more samples, and a standard…
A: Given,n=18 , x¯=81.1 , s=3.1 , and SE=0.7H0:μ=75Ha:μ>75
Q: How does the cost of shipping a standard-sized crate relate to the distance of the destination? Can…
A: distance charges 14 1400 23 2000 9 800 17 1600 10 1620 22 1900 5 620 12 1440 6 900…
Q: For each of the scenarios given below, choose the most appropriate method for analyzing the data.…
A: From the provided information, Sample size (n) = 216
Q: Use this information to answer questions #30 - #35: A set of n = 15 pairs of scores (X and Y values)…
A:
Q: a. What is the distribution of X? X - N( b. What is the distribution of x? ¤ ~ N( c. What is the…
A: Given that Mean=11 , Standard deviation=1.1 Sample size=10 Note: According to bartleby experts…
Q: Pounds 127 120 109 118 143 126 121 128 153 a. Find the correlation coefficient: r = Round to 2…
A: Note: According to Bartleby expert guidelines, we can answer only first question with their three…
Q: The data provides information on life expectancy and the number of televisions per thousand people…
A: Correlation tells about the strength and direction of an association in statistics.
Q: This is a hypothetical question: You run an RCT and there is imperfect compliance. In general, if…
A: RCT stands for Randomized Control Trials. Randomized Control Trials are the form of evaluation in…
Q: Four white and four black balls are distributed in two urns in such a way that each contains four…
A: From the given information, There are 4 white and 4 black balls are distributed in two urns in such…
Q: Write a sentence that describes the most likely population of interest and another sentence that…
A: Population consists of all individual related to study. Sample is a subpart of population that…
Q: Using R, calculate the mean and standard deviation for age of first period for this sample of women
A: The objective is to calculate the mean and standard deviation for age of first period for this…
Q: Show that the following belong to the exponential family 1. The pareto distribution: f(y; θ) =…
A:
Q: According to the February 2008 Federal Trade Commission report on consumer fraud and identity theft,…
A:
Q: The grades of seven students in the first and second grading periods are shown below. 80 78 76 82 84…
A: Given the grades of seven students in the first and second grading periods.
Obtain the

Step by step
Solved in 3 steps with 1 images

- Compare the two separate scatterplots. In particular, how do the associtation compare between women with pets vs. women without pets? Does one group have more variation in systolic blood pressure than the other? If so, for which group? Does systolic blood pressure seem higher for common ages between the two groups? If so, for which group?the soil biogeochemistry in Californian salt marshes wished to explore how two of the most common plant species, pickleweed and pacific cordgrass, affected the accumulation of nitrogen in the soil. They measured the concentration of ammonium, a molecular form of organic nitrogen, in the soil, and measured or manipulated the density of pickleweed and cordgrass. Manipulations of ½ meter square plots (20 plots per manipulation) included removing all cordgrass (cordgrass removal), removing all pickleweed (pickleweed removal), or mixed (the control - nothing removed, thus mixed plots included a mixture of natural pickleweed and cordgrass). Boxplots of ammonium concentrations in each of the three manipulation treatments. Letters indicate differences among means as determined by a Tukey posthoc test following ANOVA. (b) Overall relationship between cordgrass stem density and soil ammonium content (includes data from all plot treatments). The solid black line and the gray shading represent the…In an agricultural experiment, the effects of two fertilizers on the production of limes were measured. Twenty-three randomly selected plots of land were treated with a brand new fertilizer, and 21 randomly selected plots were treated with an old fertlizer. The number of pounds of harvested limes were measured from each plot. The results are given below. (Round answers to two decimal places.)Data: New Fertilizer Old Fertilizer 412 480 434 472 436 485 418 453 412 470 415 464 412 482 438 466 439 481 443 470 427 472 426 466 439 493 427 471 438 495 430 479 411 467 424 476 419 493 424 485 425 482 437 420 Find a 90% confidence interval for the difference between the mean weight of the harvested limes.margin of error: lower limit: upper limit: Based on the results, is the new fertilizer better than the old fertilizer? Yes, we are 90% confident that new fertilizer is better than old fertilizer. It's not clear if the new fertilizer is…
- In an agricultural experiment, the effects of two fertilizers on the production of limes were measured. Fourteen randomly selected plots of land were treated with a brand new fertilizer, and 18 randomly selected plots were treated with an old fertlizer. The number of pounds of harvested limes were measured from each plot. The results are given below. (Round answers to two decimal places.) New F. Old F. 498 429 485 428 469 427 481 421 472 412 475 419 488 431 468 436 460 415 469 428 475 417 471 437 476 437 470 420 416 426 427 419 Find a 99% confidence interval for the difference between the mean weight of the harvested limes.margin of error: lower limit: upper limit:The average weight of a Coastal male Grizzly Bear is approximately normal with E(x); =795 pounds and SD * (x) = 80 pounds. 8. How likely is it to randomly select 64 Coastal male Grizzly Bears with a sample average weight of 810 pounds or more? Which density curve is the best model for this problem?In an agricultural experiment, the effects of two fertilizers on the production of limes were measured. Nineteen randomly selected plots of land were treated with a brand new fertilizer, and 27 randomly selected plots were treated with an old fertlizer. The number of pounds of harvested limes were measured from each plot. The results are given below. (Round answers to two decimal places.) New Fertilizer Old Fertilizer 486 435 468 423 491 425 470 440 458 423 476 409 456 425 463 443 493 402 501 437 483 420 475 420 456 416 470 435 463 421 473 445 479 422 460 424 467 412 435 427 413 407 420 430 426 430 Find a 90% confidence interval for the difference between the mean weight of the harvested limes.margin of error: lower limit: upper limit: Based on the results, is the new fertilizer better than the old fertilizer? A) Yes, we are 90% confident that new fertilizer is better than old fertilizer. B) No, we are 90%…
- For a research study with 2 levels of factor A, 4 levels of factor B, and n = 8 in each treatment condition, what are the df values for the F-ratio evaluating the main effect for factor A?a. Compute the incidence rate of coronary artery disease in patients receiving the new cholesterol medication. b. Compute the incidence rate of coronary artery disease in patients receiving a placebo. attached is the image of the data for this problemIn forestry, the diameter of a tree at breast height is used to model the height of the tree. Silviculturists working in British Columbia’s boreal forest conducted a series of spacing trials to predict the heights of several species of trees. The data are the breast height diameters (in centimeters) and heights (in meters) for a sample of 18 white spruce trees. B1 B2 18.9 20.0 15.5 16.8 19.4 20.2 20.0 20.0 29.8 20.2 19.8 18.0 20.3 17.8 20.0 19.2 22.0 22.3 16.6 18.8 15.5 16.9 13.7 16.3 27.5 21.4 20.3 19.2 22.9 19.8 14.1 18.5 10.1 12.1 5.8 8.0 B1: Breast Height Diameter of White spruce (cm) B2: Height (m) a) Plot the relationship using scatter diagram between the breast height diameters and the trees’ height. Are the breast height diameters and the trees’ height linearly related? What can you infer about the relationship between the two variables? Is a linear model appropriate? b) Compare the scatter plot in (a) with the correlation coefficient…
- In a test of braking performance, a tire manufacturer measured the stopping distance for one of its tire models. On a test track, a car made repeated stops from 100 kilometres per hour. The test was run on both dry and wet pavement, with the accompanying results.The performance of two analysts in determining total mercury (mg / kg) in fish was evaluated using the absorption spectrometry method. The results on the concentrations of mercury found in fish, for each analyst, are presented in the table below: Analyst 1 Analyst 2 7 12 9 8 6 9 11 13 13 14 8 9 7 8 13 10 12 7 9 15 (a)Is the performance in determining total mercury for Analyst 1 more accurate than Analyst 2? Compare the accuracy in the results of the two analysts at a 95% confidence level. Explain. (b)Are the results obtained by the two analysts, in the concentrations of mercury found in the fish, statistically equivalent, with 95% confidence? ExplainIf a newborn lab rat receives a hormone and its weight (in ounces) is converted into a z score that is greater than +2.00, what would the researcher most likely conclude about whether or not the hormone had an effect on the rat's weight?
