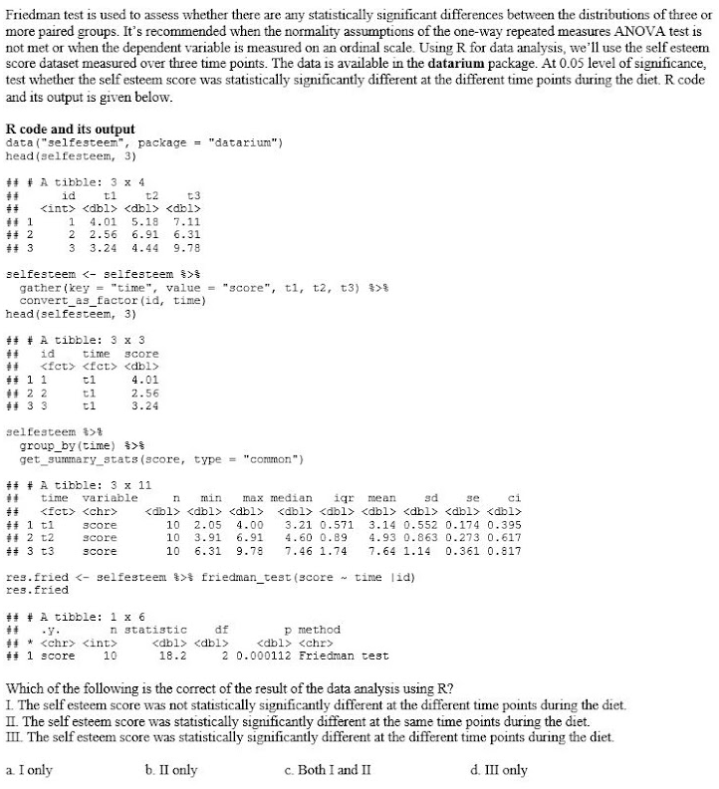
Friedman test is used to assess whether there are any statistically significant differences between the distributions of three or more paired groups. It's recommended when the normality assumptions of the one-way repeated measures ANOVA test is not met or when the dependent variable is measured on an ordinal scale. Using R for data analysis, we'll use the self esteem score dataset measured over three time points. The data is available in the datarium package. At 0.05 level of significance, test whether the self esteem score was statistically significantly different at the different time points during the diet. R code and its output is given below.
Friedman test is used to assess whether there are any statistically significant differences between the distributions of three or more paired groups. It's recommended when the normality assumptions of the one-way repeated measures ANOVA test is not met or when the dependent variable is measured on an ordinal scale. Using R for data analysis, we'll use the self esteem score dataset measured over three time points. The data is available in the datarium package. At 0.05 level of significance, test whether the self esteem score was statistically significantly different at the different time points during the diet. R code and its output is given below.

Glencoe Algebra 1, Student Edition, 9780079039897, 0079039898, 2018
18th Edition
ISBN:9780079039897
Author:Carter
Publisher:Carter
Chapter10: Statistics
Section10.3: Measures Of Spread
Problem 1GP

Related questions
Question
Transcribed Image Text:Friedman test is used to assess whether there are any statistically significant differences between the distributions of three or
more paired groups. It's recommended when the normality assumptions of the one-way repeated measures ANOVA test is
not met or when the dependent variable is measured on an ordinal scale. Using R for data analysis, we ll use the self esteem
score dataset measured over three time points. The data is available in the datarium package. At 0.05 level of significance,
test whether the self esteem score was statistically significantly different at the different time points during the diet. R code
and its output is given below.
R code and its output
data ("selfesteen", package = "datarium")
head (selfesteem, 3)
# + A tibble: 3 x 4
id
<int> <dbl> <dbl> <dbl>
t1
t2
t3
1 4.01
2 2.56
3 3.24
5.18
7.11
6.31
9.78
6.91
4.44
selfesteem <- selfesteem >
gather (key = "time", value = "score", t1, t2, t3) $>8
convert_as_factor (id, time)
head (selfesteem, 3)
+# + A tibble: 3 x 3
id
time
<fet> <fct> <dbl>
score
** 11
ti
4.01
* 2 2
4 33
t1
tl
2.56
3.24
selfesteem >
group_by (time) %>*
get_summary_atats(score, type = "common")
# # A tibble: 3 x 11
time
variable
min
max median
igr mean
sd
ci
n
se
<fct> <chr>
<dbl> <dbl> <dbl>
<dbl> <dbl> <dbl> <dbl> <dbl> <dbl>
# 1 t1
# 2 t2
+# 3 t3
10
10
2.05
3.91
4.00
3.21 0.571 3.14 0.552 0.174 0.395
4.60 0.89
3core
score
6.91
4.93 0.863 0.273 0.617
Score
10 6.31
9.78
7.46 1.74
7.64 1.14
0.361 0.817
res.fried <- selfesteem >% friedman_test (score - time lid)
res.fried
+# + A tibble: 1 x 6
p method
<dbl> <chr>
2 0.000112 Friedman test
n statistic
df
-y.
4* <chr> <int>
# 1 score
<dbl> <dbl>
10
18.2
Which of the following is the correct of the result of the data analysis using R?
I. The self esteem score was not statistically significantly different at the different time points during the diet.
II. The self esteem score was statistically significantly different at the same time points during the diet.
III. The self esteem score was statistically significantly different at the different time points during the diet.
a I only
b. II only
c. Both I and II
d. III only
Expert Solution
This question has been solved!
Explore an expertly crafted, step-by-step solution for a thorough understanding of key concepts.

This is a popular solution!

Trending now
This is a popular solution!

Step by step
Solved in 2 steps

Recommended textbooks for you
Glencoe Algebra 1, Student Edition, 9780079039897…
Algebra
ISBN:
9780079039897
Author:
Carter
Publisher:
McGraw Hill
Glencoe Algebra 1, Student Edition, 9780079039897…
Algebra
ISBN:
9780079039897
Author:
Carter
Publisher:
McGraw Hill