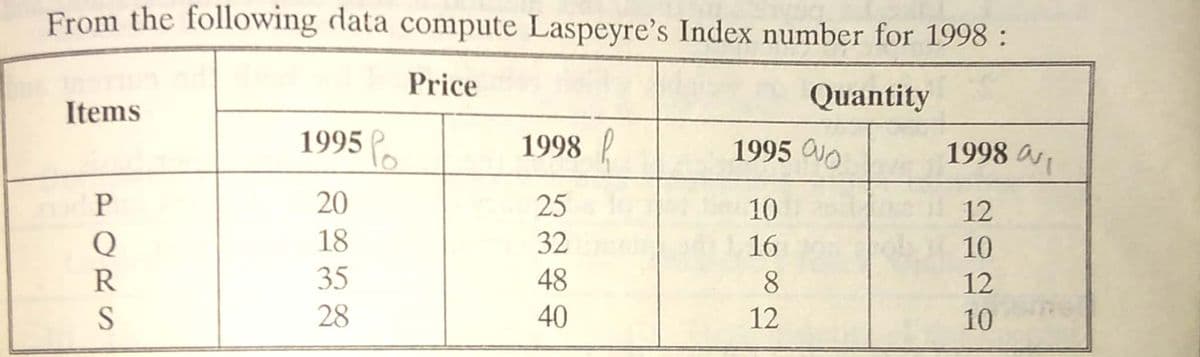
From the following data compute Laspeyre's Index number for 1998 : Price Quantity Items 1995 . 1998 1995 NO 1998 20 25 10 12 18 32 16 10 35 48 8. 12 28 40 12 10 PORS


Q: Construct the indicated confidence interval for the population mean u using the t-distribution.…
A: Sample mean = 14.8 S = 2.0 n = 6 C = 0.99 By using one sample mean confidence interval formula we…
Q: The proportion of California residents who reported insufficient rest or sleep during each of the…
A: There are two independent samples which are California and Oregon. We have to test whether the rate…
Q: deviation approximately 4 square inches. a. If the forester samples n = 9 trees, find the…
A: here AS PER GUIDELINES I HAVE CALCULATED FIRST MAIN QUESTION 1. A forester studying the effects of…
Q: An economist claims that the population standard deviation of the monthly income of all the families…
A: Given: Population sd, σ=2500Sample size, n=250Sample mean, x¯=3500
Q: Each sweat shop worker at a computer factory can put together 4.9 computers per hour on average with…
A: As per bartelby guideline expert have to answer first three subparts only dear student please upload…
Q: If N = 64, write the decision rules for a single-sample t test. Assume that the test is two-tailed…
A:
Q: Construct a confidence interval for p, - p2 at the given level of confidence. X1 = 385, ng = 545, x2…
A: As per guidelines expert have to answer first question only dear student please upload other…
Q: You want to obtain a sample to estimate a population mean. Based on previous evidence, you believe…
A:
Q: ending less time engaged with course during online than in person,At the end of the semester…
A: For online : sample size (n1) = 15 sample mean (x̄1) = Σx1 /n1 = 62/15 = 4.13 sample standard…
Q: What is the formula for the length of a numeric interval? O a. Upper limit + Lower limit Ob. Lower…
A: Here use t distribution
Q: 6. Bags checked for a certain airline flight have a mean weight of 17 kg with a standard deviation…
A: The random variable X follows normal distribution. We have to find the probability that the sample…
Q: Suppose a data set from a bike share company contains the number of daily bike rentals at each of 6…
A: Given i=1,…,23 and j=1,…,6 Find Write down a metaethical normal model that can be
Q: Consider the sample data 2, 4, and 6 with population standard deviation of 1.633. Compute the…
A: The central limit theorem states that the distribution of sample means approximately a normal…
Q: It has long been stated that the mean temperature of humans is 98.6°F. However, two researchers…
A: Solution-: Given: x¯=98.3,μ0=98.6,n=61,s=1,α=0.01 (a) State the hypothesis. (b) Test statistic=? (c)…
Q: A normal distribution has a mean of 85.3 and a standard deviation of 4.83. Find the data value…
A: Given: μ=85.3σ=4.83z=0.65
Q: (c) Calculate R2. (d) The percentage of variation in spending that is explained by a moviegoer’s…
A: The coefficient of determination is R2 or r2.
Q: Thirty percent of all customers who enter a store will make a purchase. Suppose that six customers…
A: Let X be the random variable from binomial distribution with probability (p)= 30% = 0.30 and sample…
Q: 3. By using the appendix tables, test the following hypotheses by estimating p-value. Use a = 0.05.|…
A: The random variable X follows Chi-Square distribution. We have to test the hypotheses for the given…
Q: You want to obtain a sample to estimate a population mean. Based on previous evidence, you believe…
A:
Q: The following table shows the number of sweatshirts and T-shirts sold at a shopping mall on a…
A:
Q: Source DF SS MS F P Treatment 4 1010.56 ? 29.84 ? Block ? ? 64.765 ? ? Error 20 169.33 ?…
A:
Q: Match each scatterplot shown below with one of the four specified correlations. a. 0.25 b. -0.75 C.…
A: Here, in the figure 1- it is negative correlation between two variables. It is (-0.22). In the…
Q: If N = 48, find tcv and use it to draw a t distribution with the rare and common zones labeled.…
A: The t – critical values would be obtained from the t – distribution at certain alpha% level with…
Q: Find the area under the standard normal curve that lies between z=0.55 and z = - 1.93 2. Find the…
A: As per company guidelines I solved only First questions ..thank you
Q: Problem 3. The following cross-tabulation (based on GSS18SSDS-B dataset) examines the relationship…
A: Disclaimer: Cross-Tabulation: A cross-tabulation is a statistical technique for categorical or…
Q: Construct the sampling distribution of the sample mean for the following population and with the…
A: Given that the population is Xi: 2,9,11,14 We'll draw the samples of size 2 from the given…
Q: at the Twentieth Century Electronics Company for a sample of 2 45 52 48 41 56 46 44 42 48 53 51 53…
A: “Since you have posted a question with multiple sub-parts, we will solve first three subparts for…
Q: 2. In a Midterm Examination in Statistics, there are 78 Normality. O What is the probability that a…
A: Given that X~N(μ= 43 , σ= 5 ) μ= 43 , σ= 5 Formula for Z-score Z=(X-μ)/σ Note: According to…
Q: Find the margin of error for the given values of c, s, and n. c= 0.98, s = 3.8, n 17 Click the icon…
A: We have given that Confidence interval, c = 0.98 Standard deviation, s = 3.8 Sample size, n = 17
Q: Assume that the monthly worldwide average number of airplane crashes of commercial airlines is 3.…
A: Solution
Q: Please find test statistic and p value also thank you
A: Null hypothesis: H0 : µ(1) = µ(2) = µ(3) That is, there is no significant difference in the average…
Q: Derive the mean and variance of the t distribution.
A: Given that We have to derive the mean and variance of t distribution:
Q: What is the level of confidence as a decimal? Ex 0.55 What is the margin of error? 2.509 What is the…
A:
Q: The regression equation NetIncome = 2,277 + .0307 Revenue was estimated from a sample of 100 leading…
A: Introduction: It is required to find the residual for the given (x, y) pairs.
Q: 1. Consider a sample, X1,..., Xn , of normally distributed random variables with mean u and variance…
A: Note: According to bartleby experts question answers guidelines an expert can solve only first…
Q: Here is a bivariate data set. y 51 94 89 163 65 136 67 141 63 56 46 -68 37 43 61 124 9. -156 Find…
A:
Q: Monthly Income Monthly Rent 24 7.0 16 4.5 19 6.5 31 11.2 12 4.5 27 8.5 The null hypothesis is that…
A: In testing the slope of the regression line. Test statistic, t=rn-21-r2 where, n= number of…
Q: SUB: YOU MEET THE CHEVALIER DE MERE BEFORE PASCAL Your physics professor has just invented the…
A: Given data, your physics teacher has just invented the world's the first time machine. Probability…
Q: A recent study investigated whether cell phone users experience separation anxiety when they cannot…
A:
Q: Below, n is the sample size, p is the population proportion and p is the sample proportion. Use the…
A: The random variable X follows binomial distribution. We have to find the probability that sample…
Q: Construct the sampling distribution of the sample mean for the following population and with the…
A:
Q: What is the t critical value when n = 17 and C = 95%?
A: 1.) The t critical value for given data: Given, n = 17 Confidence, C = 95%
Q: and deciduous forests make up 39.6%. Of the 426 sites v 16 as cultivated grassplot, and 61 as…
A: a) The null and alternative hypothesis Ho: The barking deer do not prefer to forge in certain…
Q: Q4-2) Find the skewness (sk) (round the answer to 3 digits after the decimal point if ne given the…
A: Given that Population Standard deviation=5.7 , Population mean=6.5 Population median=4 Sample…
Q: The value of k for a random sample of size 18 for a normal distribution such that P(-2 <t< k) =…
A:
Q: Which side will the tail be for -0.4 z score for normal distribution?
A:
Q: Let X be Contin uous random yarjable ymmetric about B let Z= 1 if 0 if
A: The objective is to find the covariance of |X| and Z when X is a continuous rv. symmetric about Q…
Q: Construct a confidence interval for p, - p, at the given level of confidence. X1 = 381, n, = 507, x,…
A:
Q: Consider the regression model y = Bo + B1×1 + B2x2 + B3(x1 × x2) + u. Which of the following…
A: Introduction: It is required to identify the statement that is false.
Q: Describe the sampling distribution of p. Round to three decimal places when necessary. N= 19,000, n=…
A: Given that Population size ( N) = 19000 Sample size ( n) = 350 P = 0.8 By using binomial…

Step by step
Solved in 2 steps with 2 images

- In a particularly small region in the Philippines, the consumer price index C depends onThe following table gives information on the Consumer Price Index (Base = 1982–84) and the monthly take-home pay of Bill Martin, an employee at Ford Motor Corporation, from 1982−84 and 2018. Consumer Price Index Mr. Martin’s Monthly Year (1982−84 = 100) Take-Home Pay 1982−84 100.0 $ 600 2018 251.107 7,000The table below shows percentage changes (xi) in the Dow-Jones index over the first five trading days of each of thirteen years and also the corresponding percentage changes (yi) in another index. xi yi 1.5 14.9 0.2 -9.2 -0.1 19.6 2.8 20.3 2.2 -3.7 -1.6 27.7 -1.3 22.6 5.6 2.3 -1.4 11.9 1.4 27.0 1.5 -4.3 -4.7 20.3 1.1 4.2 1- Calculate the sample correlation and interpret. 2- Test at the 1% significance level, against a two-sided alternative, the null hypothesis that the population correlation is 0. Thanks.
- Construct index number of price from the following data byapplying: Marshall-Edgeworth’s methodand comment on the results. Commodity Price Quantty Price QuanttyA 2 8 4 6B 5 10 6 5C 4 14 5 10D 2 19 2 13Construct index number of price from the following data byapplying: 1)Paasche’s method Commodity Price Quantty Price QuanttyA 2 8 4 6B 5 10 6 5C 4 14 5 10D 2 19 2 13Construct index number of price from the following data byapplying: a ) Laspeyre’s method Commodity Price Quantty Price QuanttyA 2 8 4 6B 5 10 6 5C 4 14 5 10D 2 19 2 13
- The following table gives the prices of some food items in the base year and current year and the quantities sold in the base year and current year. Commodity 2000 2005 Price (K) Quantity Price (K) Quantity A B C 15 20 4 15 5 10 22 27 7 12 4 5 Compute the following price index numbers for 2005 from the above table: i. Laspeyre’s price index number ii. Paasche’s price index numberThe table below shows the year open and year closing price of the S&P 500 Stock Index from 2005 to 2020: Year Year Open Year Close Annual Percent Change 2005 $ 1,202.08 $ 1,248.29 2006 $ 1,268.08 $ 1,418.30 2007 $ 1,416.60 $ 1,468.36 2008 $ 1,447.16 $ 903.25 2009 $ 931.80 $ 1,115.10 2010 $ 1,132.99 $ 1,257.64 2011 $ 1,271.87 $ 1,257.60 2012 $ 1,277.06 $ 1,426.19 2013 $ 1,462.42 $ 1,848.36 2014 $ 1,831.98 $ 2,058.90 2015 $ 2,058.20 $ 2,043.94 2016 $ 2,012.66 $ 2,238.83 2017 $ 2,257.83 $ 2,673.61 2018 $ 2,695.81 $ 2,506.85 2019 $ 2,510.03 $ 3,230.78 2020 $ 3,257.85 $ 3,756.07 Find the annual percent change for the S&P 500 from 2005 to 2020; (Put those values in the table above) Compute the mean,…A mining company finds that daily lost-work injuries averages to 1.2. If the local union contract has a clause requiring that the mine be shut down as soon as three workers incur lost-work injuries, on what percentage of the days will the mine be operational throughout the day?
- 1. What does calculating the Bendford's average tell us about Individuals? 2. What can we learn by looking at an individual's transactions using the lens of Bendford's law?We have the following data of yields of regular treasury bondsThe following data shows prices of three types of fruits over ten years. Year Mango Orange Blackberry 1 50 100 150 2 55 115 155 3 60 100 125 4 55 110 130 5 63 120 120 6 65 110 125 7 70 105 140 8 75 120 170 9 60 130 160 10 65 135 175 Take year 1 as the base year. In that year the production of Mango, Orange, and Blackberry was 50, 25,and 15 thousand kilograms respectively.a) Find the un-weighted index of prices.b) Find the Laspeyres index for fruit prices.c) What is the change in price from year 6 to year 7 if you use un-weighted index.d) What is the change in price from year 6 to year 7 if you use Laspeyres index.e) Is answer to c is different from answer to d. Explain your answer