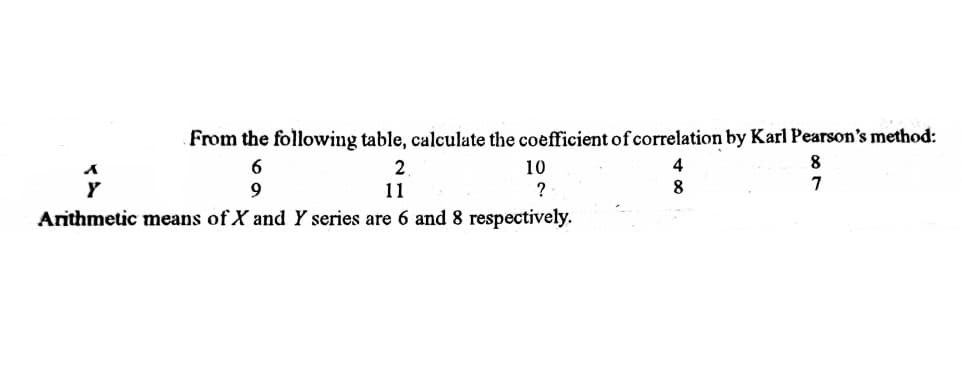
From the following table, calculate the coefficient of correlation by Karl Pearson's method: 8. 7 6. 2 10 4 11 8 Arithmetic means of X and Y series are 6 and 8 respectively.


Q: Write the equation of the least-squares regression line. Use the full accuracy shown in the Excel ou...
A:
Q: Calculate Fisher's Ideal Index from the following data and prove that it satisfies both the time rev...
A:
Q: 6. Determine the pattern and find out the numbers which will complete the sequence. a. 58, 68, 57, 6...
A: Given problem Given that 6) a) 58,68,57,67,56,___ 58 is decreased by 1 i.e., 57 and then decreas...
Q: 3 3 P(B) = and P(B A) Find P (A/B) and P (BIA), show Given P(A) 8 4 whether A and B are independent.
A:
Q: The variance of 100, 201, 203, 205 and 207 is 2168.2. The variance of 140, 165, 108, 250 and 202 is:
A:
Q: Suppose you are an auditor, wishing to estimate the true mean dollar amount of a company’s accounts ...
A:
Q: The diameter of shafts produced in a factory conforms to normal distribution. 31 per cent of the sha...
A:
Q: The proportion of drivers who use seat belts depends on things like age (young people are more likel...
A: Given The data is as follows:
Q: 2. Is there an association between square footage and asking price? Describe the association in term...
A: Is there an association between square footage and asking price? Describe the association in terms ...
Q: Illustration 28. (b) If r., and multiple correlation coefficient R " 0.77, r, = 0.72 and P23 = 0.52,...
A:
Q: A bar offers alcoholic and non-alcoholic beverages. They have 12 alcoholic beverages that cost $10 o...
A: GivenNo.of alcoholic beverages that cost $10 or more = 12No. of alcoholic beverages that cost less t...
Q: The thickness of a flange on an aircraft component is uniformly distributed between 0.95 and 1.05 mi...
A:
Q: Direction: Solve the problem by using Pearson r and follow the steps shown in Day 3 example. NOTE: T...
A: We have given that, X :- 5, 7, 9, 10, 11, 12, 15, 17, 20, 25 Y:- 6, 15, 16, 12, 21, 22, 8, 27, 5, ...
Q: A population of values has a normal distribution with μ=248.4μ=248.4 and σ=23.6σ=23.6. You intend to...
A: Let X be the value. Given X follows normal distribution with parameters µ = 248.4 and σ = 23.6. The ...
Q: A bag contains 5 white and 8 red balls. Two drawings of 3 balls are made such that (a) the balls are...
A:
Q: create a graph out of the encircled column then interpret it. i need it rush. thank u
A: The objective is to create the graph for the column game. The game variable has three categories :...
Q: If 11% of the population has a certain illness , what is the expected number of ill people in a rand...
A:
Q: Suppose that g is an easy probability density function to generate from, and h is a non- negative fu...
A: According to company rule we can solve first three sub part of question if u want solution of other ...
Q: [URGENT] in 5 minutes Suppose, in a family the couple wishes to have exactly two female children. T...
A:
Q: what are the odds that all six of them have a pet?
A: here total household = 125 million total household have pet = 86 million
Q: Indicate whether each of the following constitutes data collected from a population or a sample. a. ...
A:
Q: A gaming company claimed that their role-playing games take over 65 hours to complete. A sample of 3...
A: Given : Sample size (n) =300 Sample mean (X¯) = 63 Sample Standard deviation (S) = 10 Significance l...
Q: Allustration 27. For a bivariate data, you are given the following information: E(X- 58) = 46 EXX- 5...
A:
Q: From the following data of the marks obtained by 8 students in the Accountancy and Statistics papers...
A:
Q: Below are exam scores from a statistics class with 25 students: 100, 88, 90, 72, 76, 64, 68, 60, 78,...
A:
Q: : 20. Calculate the standard deviation from the following data : Size of item Frequency Size of item...
A:
Q: a) Four married couples have bought 8 seats in the same row for a concert. In how many different way...
A: Since you have asked multiple questions, we will solve the first question for you. If you want any s...
Q: 2. Random samples of size n = 2 are drawn from a finite population consisting of the numbers 1,3,5, ...
A:
Q: Given that the mean weight of senior high school students is 65kg with a standard deviation of 10. W...
A: Given information Population mean µ = 65 kg Standard deviation σ = 10 We have to determine the perce...
Q: A rifleman gets 3 hits out of every 10 shots on the average. Assuming that the probability that he g...
A:
Q: SITUATION 7 Test the hypothesis that the average content of containers of a particular lubricant is ...
A: Given data set is10.2,9.7,10.1,10.3,10.1,9.8,9.9,10.4,10.5,9.8sample size(n)=10
Q: Classes 10 11 13 6 8 13 9 10 6 13 14 9 7 10 8 12 10 12 10 10 10 8 7 12 12 10 10 12 10 12 11 10 7 12 ...
A: Confidence interval formula:
Q: 23. Weighing Seals with a Camera Using the listed width/weight data, find the best pre- dicted weigh...
A: The regression are used to predict the value. It is based on the least square method. Each regressio...
Q: 1.3 Let X1,. , X12 P(0). Let Ho : 0 = } and H : 0 < . We reject Ho if S = X; < 2. Find the powers K(...
A:
Q: For a standard normal distribution, find: P(z < -1.91) Express the probability as a decimal roun...
A: The objective is to find the indicated area under the standard normal curve.
Q: QUESTION NO. 9 The length of time Y, in minutes, required to generate a human reflex to tear gas has...
A:
Q: About % of the area under the curve of the standard normal distribution is outside the interval z=[−...
A: Note: this probability value calculated from standard normal distribution table
Q: Q10. A population, T is normally distributed with unknown mean, µ and variance 49. A sample of size ...
A:
Q: If X and Y are independent RVs following N(8, 2) and N(12, 4/3 ) respectively, find the value of 2 s...
A:
Q: chance
A: A lottery game involves choosing numbers at random to fill Each of the blanks is filled by a rand...
Q: 6. Calculate Coefficient of Correlation between the values of X and Y given below: Values of X: 65 6...
A: By correlation we mean the interdependence or association between two variables. If two variables ar...
Q: Suppose a left-skewed distribution exists with a mean of 133 and standard deviation of 15. Consider ...
A: Given data,Mean μ=133sd σ=15n=39
Q: B. The following are the scores of 40 students in a test. Compute the mean score. Use the space belo...
A:
Q: Illustration 37. Calculate the (i) two regression co-efficients, (ii). Co-efficient of correlation, ...
A:
Q: The following C.I.s were obtained for the mean of the same po [16, 23] and [18, 25]. Identify the co...
A: From the given information, The C.I for the mean are [16, 23] and [18, 25] Consider, [16, 23].
Q: Find out the value of median from the following data : Daily wages (Rs) Number of Workers 10, 5, 7, ...
A: Solution:
Q: Calculate the coefficient of concurrent deviations from the data given below 1988 Year 1985 1986 198...
A:
Q: Customers arrive at a holding facility at random according to a Poison process (Nt , t ≥ 0) having r...
A: Solution:
Q: 5. Suppose that the result of the third quarter Exam of MSU-SHS is normally distributed has mean of ...
A:
Q: 5. Danielle flips her coin three times. What are her chances of getting three straight heads or thre...
A: We know that Sample space=S S = {HHH, HHT, HTH, HTT, THH, THT, TTH, TTT}

Step by step
Solved in 3 steps with 3 images

- Suppose you have a sample of size n for variables X and Y. The sample covariance of X and Y is Cov(X,Y) = 1,000, the sample standard deviation for X is Sx=20 and the sample standard deviation for Y is SY=75. What is the sample correlation coefficient, r?Consider two securities, the first having μ1 = 1 and σ1 = 0.1, and the secondhaving μ2 = 0.8 and σ2 = 0.12. Suppose that they are negatively correlated,with ρ = −0.8. Denote the expected return and its standard deviation as functions of π byμ(π ) and σ (π ). The pair (μ(π ), σ (π )) trace out a curve in the plane as πvaries from 0 to 1. Plot this curve in R.2 - What is the median value of the classified frequency series given in the table below? calculate.A) 111.2B) 112.1C) 113.5D) 112.6E) 110.9
- A tax accountant would like to test the claim that the proportion of individuals who owe when filing their taxes is greater than 0.20. If the z− test statistic was calculated as z=1.94, does the tax accountant have enough evidence to reject the null hypothesis? Assume α=0.05.For two random variables X and Y that follow exponential distributions with rates λ1 and λ2 respectively, calculate E(E(X|Y )) when the correlation between X and Y is ρ = 0.5.Find Pearson’s r for the following data, and then test the null hypothesis that the correlation coefficient is equal to zero. Use a Type I error probability of 0.05 .
- From a sack of fruit containing 3 oranges, 2 apples, and 3 bananas, a random sample of 5 pieces of fruit is selected. If X is the number of oranges and Y is the number of apples in the sample, the joint probability distribution of X and Y is given by the accompanying function. Determine the correlation coefficient between X and Y. What is PXY equal to?A random sample of n = 16 scores is obtained from a population with a mean of μ = 80, and a treatment is administered to the sample. After treatment, the sample mean is found to be M = 82. Assuming the sample variance is s 2 = 1600, what is the estimated d?Suppose that the 101 randomly selected eighth-grade students (mentioned in question 6) took a “practice” test similar to the official standardized test a month before the official test was administered. The researchers reported that the (two-tailed) statistical test of the difference between the practice and official test scores resulted in t100 = -2.32, p < .05. (a) Given that the difference score was computed as D = (practice score – official score), do the reported results indicate that students scored significantly higher or lower on the official test relative to the practice test? Explain. (b) If we constructed the corresponding 95% confidence interval for the mean difference (between the practice and official test scores) in the population, would it include zero? Explain.
- A. To test for the significance of the phi correlation, one must use the ______________ distribution. Group of answer choices: 1.t 2. Chi-square 3. z 4. F B. To test for the significance of a Pearson correlation, one must use the ______________ distribution. Group Answer Choices: 1. F 2. Chi-square 3. z 4. tA researcher obtains M = 45 with SS = 250 for a sample of n = 10 women and M = 49 with SS = 270 for a sample of n = 10 men. If the two samples are used to evaluate the mean difference between the two populations, what value will be obtained for the t statistic?ON QUESTION F HOW WOULD I SHOW THE EVENT IN EXCEL FORMULA?