From the previous graph, you can tell that Simone is willing to pay $ for her 8th slice of apple pie each week. Because she has to pay only $3.00 per slice, the consumer surplus she gains from the 8th slice of apple pie is S Suppose the price of apple pie were to fall to $2.25 per slice. At this lower price, Simone would receive a consumer surplus of S 18th slice of apple pie she buys. The following graph shows the weekly market demand for apple pie in a small economy. Ise the purple point (diamond symbol) to shade the area representing consumer surplus when the price (P) of apple pie is $3.00 per slice. Then, use the green point (triangle symbol) to shade the area representing additional consumer surplus when the price falls to $2.25 per slice. ? Dollars per slice) 7.50 6.75 6.00 5.25 Demand 4.50 3.75 3.00 2.25 1.50 0.75 0 0 P= $3.00 P=$2.25 Small Economy's Weekly Demand 40 80 100 120 160 180 200 140 QUANTITY (Thousands of slices of apple pie) 20 60 Initial Consumer Surplus (P-$3.00) from the Additional Consumer Surplus (P-$2.25)
From the previous graph, you can tell that Simone is willing to pay $ for her 8th slice of apple pie each week. Because she has to pay only $3.00 per slice, the consumer surplus she gains from the 8th slice of apple pie is S Suppose the price of apple pie were to fall to $2.25 per slice. At this lower price, Simone would receive a consumer surplus of S 18th slice of apple pie she buys. The following graph shows the weekly market demand for apple pie in a small economy. Ise the purple point (diamond symbol) to shade the area representing consumer surplus when the price (P) of apple pie is $3.00 per slice. Then, use the green point (triangle symbol) to shade the area representing additional consumer surplus when the price falls to $2.25 per slice. ? Dollars per slice) 7.50 6.75 6.00 5.25 Demand 4.50 3.75 3.00 2.25 1.50 0.75 0 0 P= $3.00 P=$2.25 Small Economy's Weekly Demand 40 80 100 120 160 180 200 140 QUANTITY (Thousands of slices of apple pie) 20 60 Initial Consumer Surplus (P-$3.00) from the Additional Consumer Surplus (P-$2.25)

Essentials of Economics (MindTap Course List)
8th Edition
ISBN:9781337091992
Author:N. Gregory Mankiw
Publisher:N. Gregory Mankiw
Chapter4: The Market Forces Of Supply And Demand
Section4.2: Demand
Problem 2QQ

Related questions
Question
Note:-
- Do not provide handwritten solution. Maintain accuracy and quality in your answer. Take care of plagiarism.
- Answer completely.
- You will get up vote for sure.
Transcribed Image Text:From the previous graph, you can tell that Simone is willing to pay $
for her 8th slice of apple pie each week. Because she has to pay only
$3.00 per slice, the consumer surplus she gains from the 8th slice of apple pie is S
Suppose the price of apple pie were to fall to $2.25 per slice. At this lower price, Simone would receive a consumer surplus of $
8th slice of apple pie she buys.
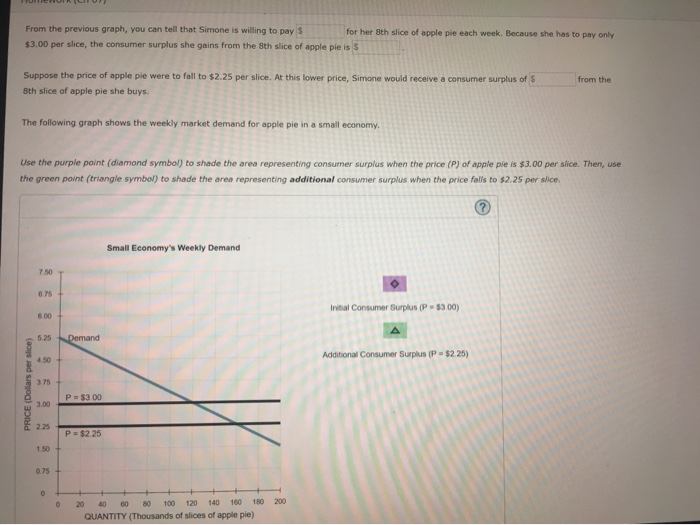
The following graph shows the weekly market demand for apple pie in a small economy.
Use the purple point (diamond symbol) to shade the area representing consumer surplus when the price (P) of apple pie is $3.00 per slice. Then, use
the green point (triangle symbol) to shade the area representing additional consumer surplus when the price falls to $2.25 per slice.
PRICE (Dollars per slice)
7.50
6.75
6.00
5.25
4.50
3.75
3.00
2.25
1.50
0.75
0
Demand
P = $3.00
P = $2.25
Small Economy's Weekly Demand
0 20 40 60 80 100 120
160 180 200
140
QUANTITY (Thousands of slices of apple pie)
Initial Consumer Surplus (P-$3.00)
from the
Additional Consumer Surplus (P-$2.25)
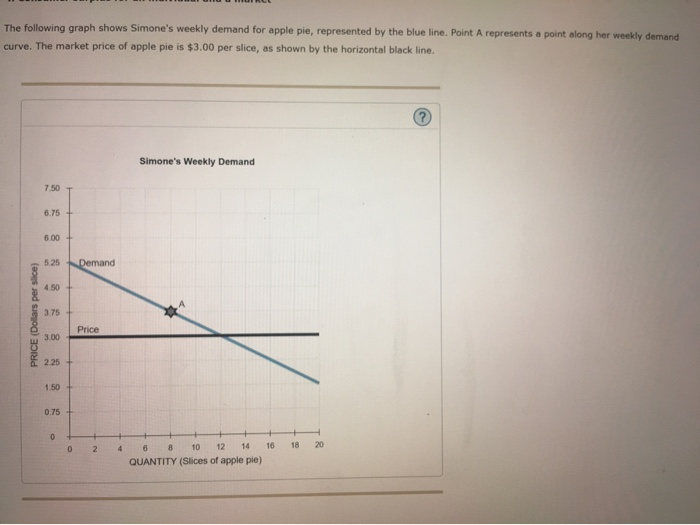
Transcribed Image Text:The following graph shows Simone's weekly demand for apple pie, represented by the blue line. Point A represents a point along her weekly demand
curve. The market price of apple pie is $3.00 per slice, as shown by the horizontal black line.
PRICE (Dollars per slice)
7.50
6.75
6.00
5.25 Demand
4.50
3.75
3.00
2.25
1.50
0.75
0
0
Price
2
4
Simone's Weekly Demand
10
12
14
6 8
QUANTITY (Slices of apple pie)
16
18 20
Expert Solution
This question has been solved!
Explore an expertly crafted, step-by-step solution for a thorough understanding of key concepts.

Step by step
Solved in 6 steps with 4 images

Knowledge Booster


Learn more about
Need a deep-dive on the concept behind this application? Look no further. Learn more about this topic, economics and related others by exploring similar questions and additional content below.Recommended textbooks for you
Essentials of Economics (MindTap Course List)
Economics
ISBN:
9781337091992
Author:
N. Gregory Mankiw
Publisher:
Cengage Learning

Brief Principles of Macroeconomics (MindTap Cours…
Economics
ISBN:
9781337091985
Author:
N. Gregory Mankiw
Publisher:
Cengage Learning

Essentials of Economics (MindTap Course List)
Economics
ISBN:
9781337091992
Author:
N. Gregory Mankiw
Publisher:
Cengage Learning
Brief Principles of Macroeconomics (MindTap Cours…
Economics
ISBN:
9781337091985
Author:
N. Gregory Mankiw
Publisher:
Cengage Learning


Economics (MindTap Course List)
Economics
ISBN:
9781337617383
Author:
Roger A. Arnold
Publisher:
Cengage Learning

Economics Today and Tomorrow, Student Edition
Economics
ISBN:
9780078747663
Author:
McGraw-Hill
Publisher:
Glencoe/McGraw-Hill School Pub Co