From the scatterplot and correlation chart below, write a conclusion that includes the following information. A survey was conducted to determine the number of pets in household and monthly expenditure on pet food for a sample of students at Central Piedmont Community College (CPCC). 1. What is the explanatory and response variable. 2. What is the equation of the regression line? 3. What is the correlation coefficient and is it significant? 4. Based on this scatter plot, please provide an interpretation of the slope and the y- intercept in one or two sentences. (If there is no valid interpretation please explain why) uner12 Number of pets in household Monthly food expenditure (5)
From the scatterplot and correlation chart below, write a conclusion that includes the following information. A survey was conducted to determine the number of pets in household and monthly expenditure on pet food for a sample of students at Central Piedmont Community College (CPCC). 1. What is the explanatory and response variable. 2. What is the equation of the regression line? 3. What is the correlation coefficient and is it significant? 4. Based on this scatter plot, please provide an interpretation of the slope and the y- intercept in one or two sentences. (If there is no valid interpretation please explain why) uner12 Number of pets in household Monthly food expenditure (5)

Glencoe Algebra 1, Student Edition, 9780079039897, 0079039898, 2018
18th Edition
ISBN:9780079039897
Author:Carter
Publisher:Carter
Chapter4: Equations Of Linear Functions
Section4.5: Correlation And Causation
Problem 24PFA

Related questions
Question
Thank you
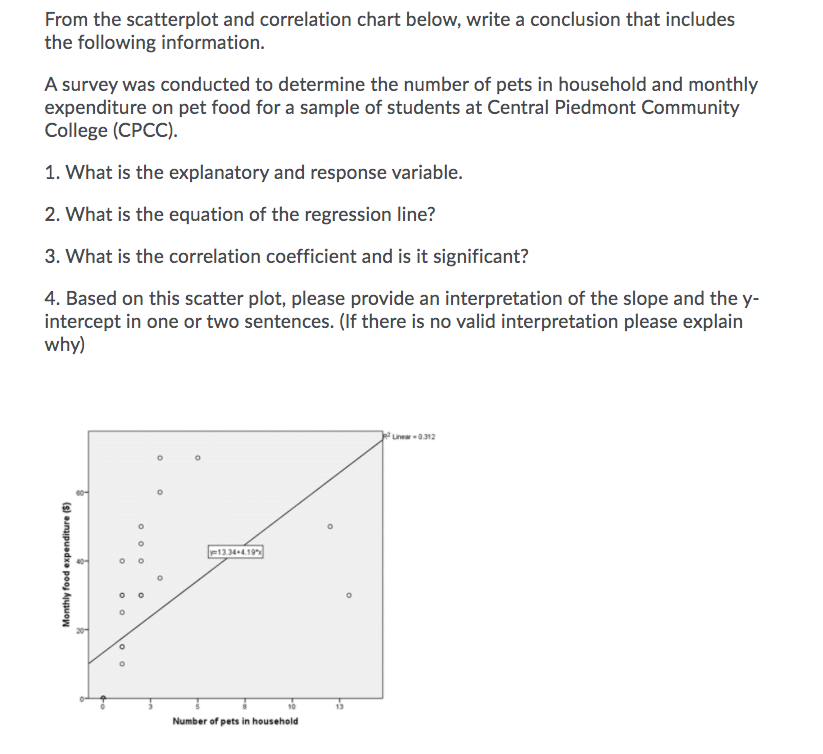
Transcribed Image Text:From the scatterplot and correlation chart below, write a conclusion that includes
the following information.
A survey was conducted to determine the number of pets in household and monthly
expenditure on pet food for a sample of students at Central Piedmont Community
College (CPCC).
1. What is the explanatory and response variable.
2. What is the equation of the regression line?
3. What is the correlation coefficient and is it significant?
4. Based on this scatter plot, please provide an interpretation of the slope and the y-
intercept in one or two sentences. (If there is no valid interpretation please explain
why)
Unear -0312
1334+4.19
13
Number of pets in household
Monthly food expenditure ($)
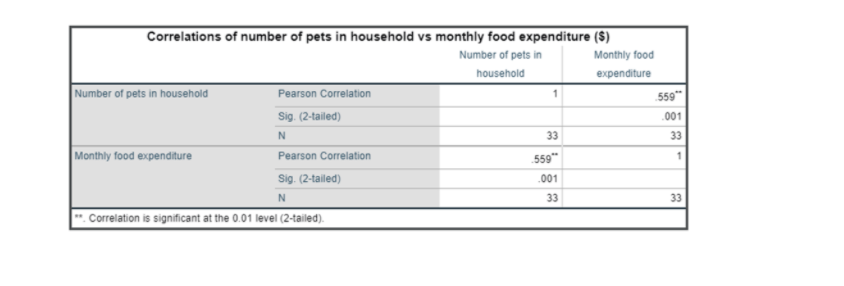
Transcribed Image Text:Correlations of number of pets in household vs monthly food expenditure ($)
Number of pets in
Monthly food
household
expenditure
Number of pets in household
Pearson Correlation
Sig. (2-tailed)
1
559
001
N
33
33
Monthly food expenditure
Pearson Correlation
559"
Sig. (2-tailed)
.001
N
33
33
-. Correlation is significant at the 0.01 level (2-tailed).
Expert Solution
This question has been solved!
Explore an expertly crafted, step-by-step solution for a thorough understanding of key concepts.

This is a popular solution!

Trending now
This is a popular solution!

Step by step
Solved in 2 steps with 2 images

Recommended textbooks for you
Glencoe Algebra 1, Student Edition, 9780079039897…
Algebra
ISBN:
9780079039897
Author:
Carter
Publisher:
McGraw Hill

Functions and Change: A Modeling Approach to Coll…
Algebra
ISBN:
9781337111348
Author:
Bruce Crauder, Benny Evans, Alan Noell
Publisher:
Cengage Learning

Big Ideas Math A Bridge To Success Algebra 1: Stu…
Algebra
ISBN:
9781680331141
Author:
HOUGHTON MIFFLIN HARCOURT
Publisher:
Houghton Mifflin Harcourt
Glencoe Algebra 1, Student Edition, 9780079039897…
Algebra
ISBN:
9780079039897
Author:
Carter
Publisher:
McGraw Hill
Functions and Change: A Modeling Approach to Coll…
Algebra
ISBN:
9781337111348
Author:
Bruce Crauder, Benny Evans, Alan Noell
Publisher:
Cengage Learning
Big Ideas Math A Bridge To Success Algebra 1: Stu…
Algebra
ISBN:
9781680331141
Author:
HOUGHTON MIFFLIN HARCOURT
Publisher:
Houghton Mifflin Harcourt