What is the predicted value for accidents per 1000 licenses for a city that has 13% of its licensed drivers under age 21, according to the estimated regression equation? O2.962 O 2.135 O 2.634 O 1.142
What is the predicted value for accidents per 1000 licenses for a city that has 13% of its licensed drivers under age 21, according to the estimated regression equation? O2.962 O 2.135 O 2.634 O 1.142

Glencoe Algebra 1, Student Edition, 9780079039897, 0079039898, 2018
18th Edition
ISBN:9780079039897
Author:Carter
Publisher:Carter
Chapter4: Equations Of Linear Functions
Section4.5: Correlation And Causation
Problem 2AGP

Related questions
Question
Transcribed Image Text:2.5
1.5
0.5
6.
10
12
14
16
18
20
Percentage of drivers under age 21
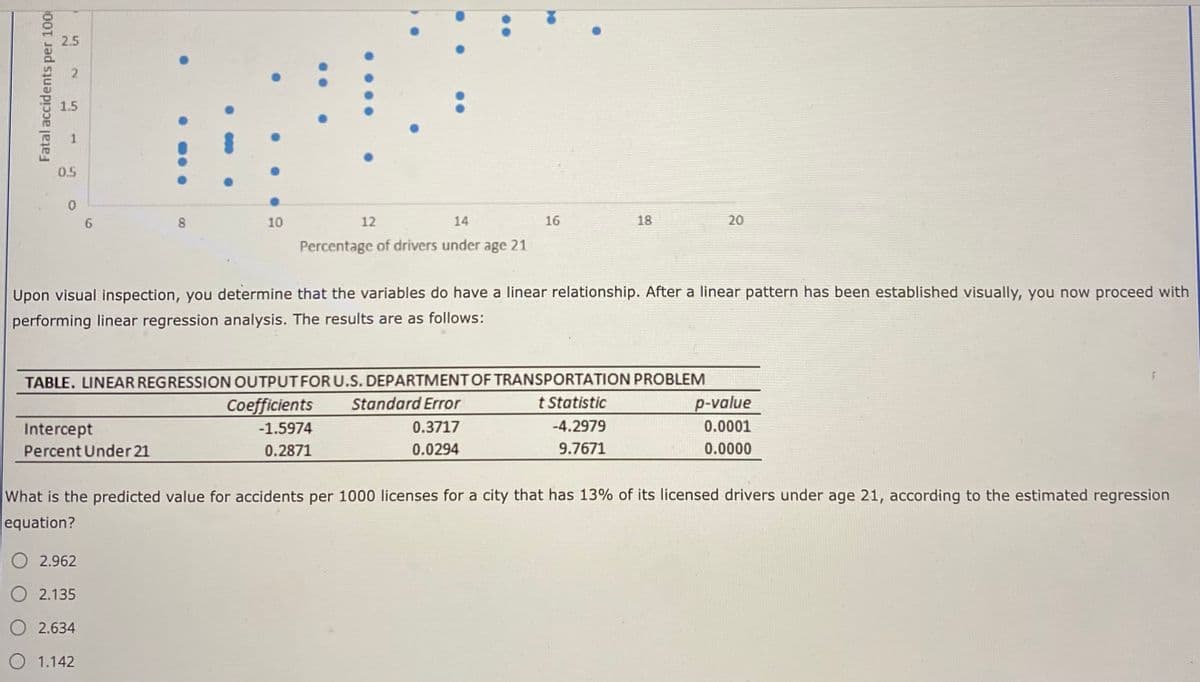
Upon visual inspection, you determine that the variables do have a linear relationship. After a linear pattern has been established visually, you now proceed with
performing linear regression analysis. The results are as follows:
TABLE. LINEAR REGRESSION OUTPUTFOR U.S. DEPARTMENT OF TRANSPORTATION PROBLEM
Coefficients
Standard Error
t Statistic
p-value
Intercept
-1.5974
0.3717
-4.2979
0.0001
Percent Under 21
0.2871
0.0294
9.7671
0.0000
What is the predicted value for accidents per 1000 licenses for a city that has 13% of its licensed drivers under age 21, according to the estimated regression
equation?
O 2.962
O 2.135
O 2.634
O 1.142
....
..
00
Fatal accidents per 100
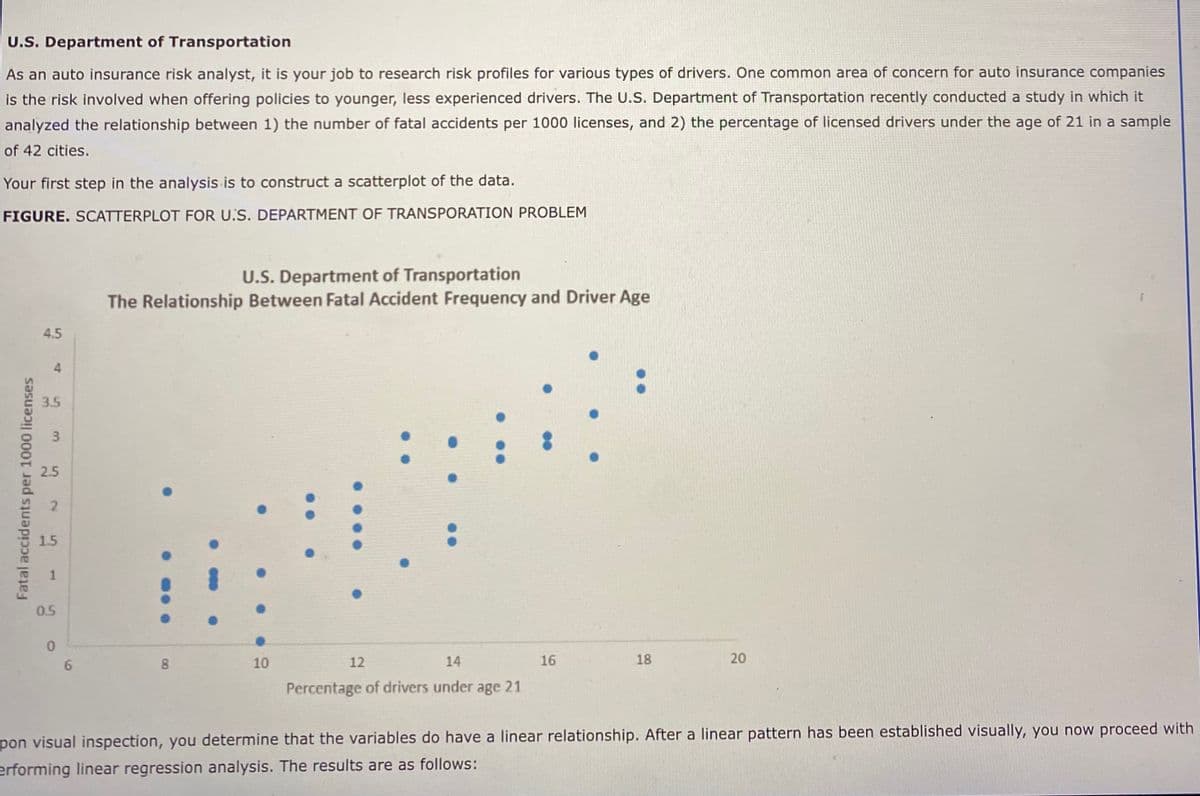
Transcribed Image Text:U.S. Department of Transportation
As an auto insurance risk analyst, it is your job to research risk profiles for various types of drivers. One common area of concern for auto insurance companies
is the risk involved when offering policies to younger, less experienced drivers. The U.S. Department of Transportation recently conducted a study in which it
analyzed the relationship between 1) the number of fatal accidents per 1000 licenses, and 2) the percentage of licensed drivers under the age of 21 in a sample
of 42 cities.
Your first step in the analysis is to construct a scatterplot of the data.
FIGURE. SCATTERPLOT FOR U.S. DEPARTMENT OF TRANSPORATION PROBLEM
U.S. Department of Transportation
The Relationship Between Fatal Accident Frequency and Driver Age
4.5
4.
3.5
3.
2.5
1.5
0.5
0.
6.
8
10
12
14
16
18
20
Percentage of drivers under age 21
pon visual inspection, you determine that the variables do have a linear relationship. After a linear pattern has been established visually, you now proceed with
erforming linear regression analysis. The results are as follows:
2.
1.
Fatal accidents per 1000 licenses
Expert Solution
This question has been solved!
Explore an expertly crafted, step-by-step solution for a thorough understanding of key concepts.

This is a popular solution!

Trending now
This is a popular solution!

Step by step
Solved in 2 steps with 1 images

Recommended textbooks for you
Glencoe Algebra 1, Student Edition, 9780079039897…
Algebra
ISBN:
9780079039897
Author:
Carter
Publisher:
McGraw Hill

Big Ideas Math A Bridge To Success Algebra 1: Stu…
Algebra
ISBN:
9781680331141
Author:
HOUGHTON MIFFLIN HARCOURT
Publisher:
Houghton Mifflin Harcourt
Glencoe Algebra 1, Student Edition, 9780079039897…
Algebra
ISBN:
9780079039897
Author:
Carter
Publisher:
McGraw Hill
Big Ideas Math A Bridge To Success Algebra 1: Stu…
Algebra
ISBN:
9781680331141
Author:
HOUGHTON MIFFLIN HARCOURT
Publisher:
Houghton Mifflin Harcourt