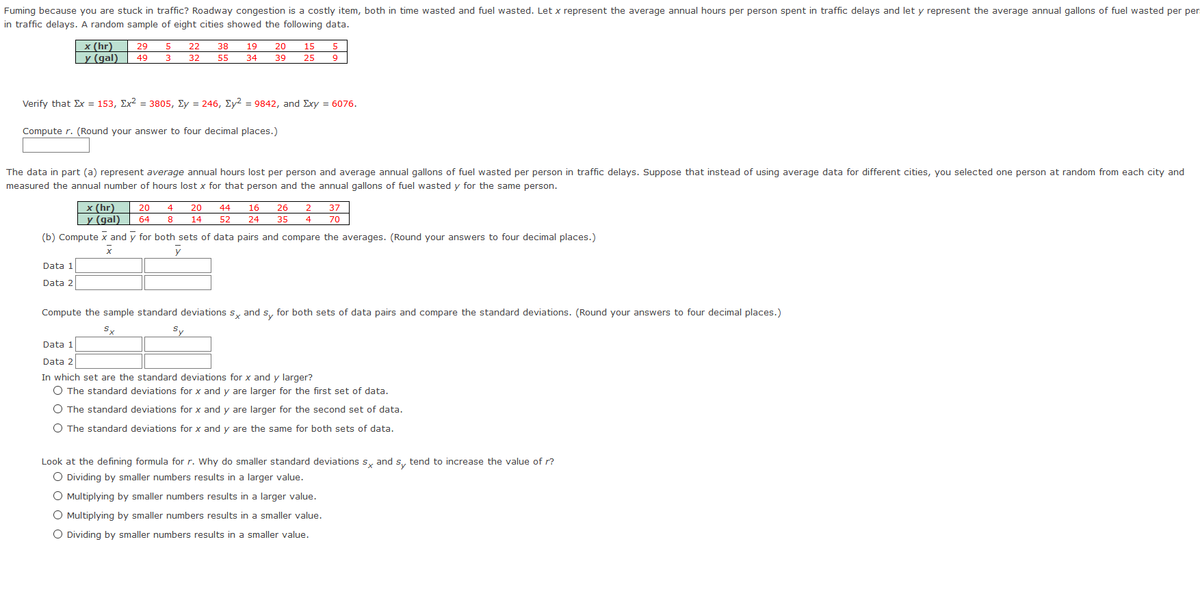
Fuming because you are stuck in traffic? Roadway congestion is a costly item, both in time wasted and fuel wasted. Let x represent the average annual hours per person spent in traffic delays and let y represent the average annual gallons of fuel wasted per per in traffic delays. A random sample of eight cities showed the following data. x (hr) 29 LY (gal) 49 22 38 32 55 15 25 3 34 39 Verify that Ex = 153, Ex? = 3805, Ey = 246, Ey? = 9842, and Exy = 6076. Compute r. (Round your answer to four decimal places.) The data in part (a) represent average annual hours lost per person and average annual gallons of fuel wasted per person in traffic delays. Suppose that instead of using average data for different cities, you selected one person at random from each city and measured the annual number of hours lost x for that person and the annual gallons of fuel wasted y for the same person. x (hr) 20 Ly (gal) 64 (b) Compute x and y for both sets of data pairs and compare the averages. (Round your answers to four decimal places.) 20 44 16 14 52 24 35 4 70 Data 1 Data 2 Compute the sample standard deviations s, and s, for both sets of data pairs and compare the standard deviations. (Round your answers to four decimal places.) Sx Sy Data 1 Data 2 In which set are the standard deviations for x and y larger? O The standard deviations for x and y are larger for the first set of data. O The standard deviations for x and y are larger for the second set of data. O The standard deviations for x and y are the same for both sets of data. Look at the defining formula for r. Why do smaller standard deviations s, and s, tend to increase the value of r? O Dividing by smaller numbers results in a larger value. O Multiplying by smaller numbers results in a larger value. O Multiplying by smaller numbers results in a smaller value. O Dividing by smaller numbers results in a smaller value.


Inverse Normal Distribution
The method used for finding the corresponding z-critical value in a normal distribution using the known probability is said to be an inverse normal distribution. The inverse normal distribution is a continuous probability distribution with a family of two parameters.
Mean, Median, Mode
It is a descriptive summary of a data set. It can be defined by using some of the measures. The central tendencies do not provide information regarding individual data from the dataset. However, they give a summary of the data set. The central tendency or measure of central tendency is a central or typical value for a probability distribution.
Z-Scores
A z-score is a unit of measurement used in statistics to describe the position of a raw score in terms of its distance from the mean, measured with reference to standard deviation from the mean. Z-scores are useful in statistics because they allow comparison between two scores that belong to different normal distributions.
Fuming because you are stuck in traffic? Roadway congestion is a costly item, both in time wasted and fuel wasted. Let x represent the average annual hours per person spent in traffic delays and let y represent the average annual gallons of fuel wasted per person in traffic delays. A random sample of eight cities showed the following data.
I need help with
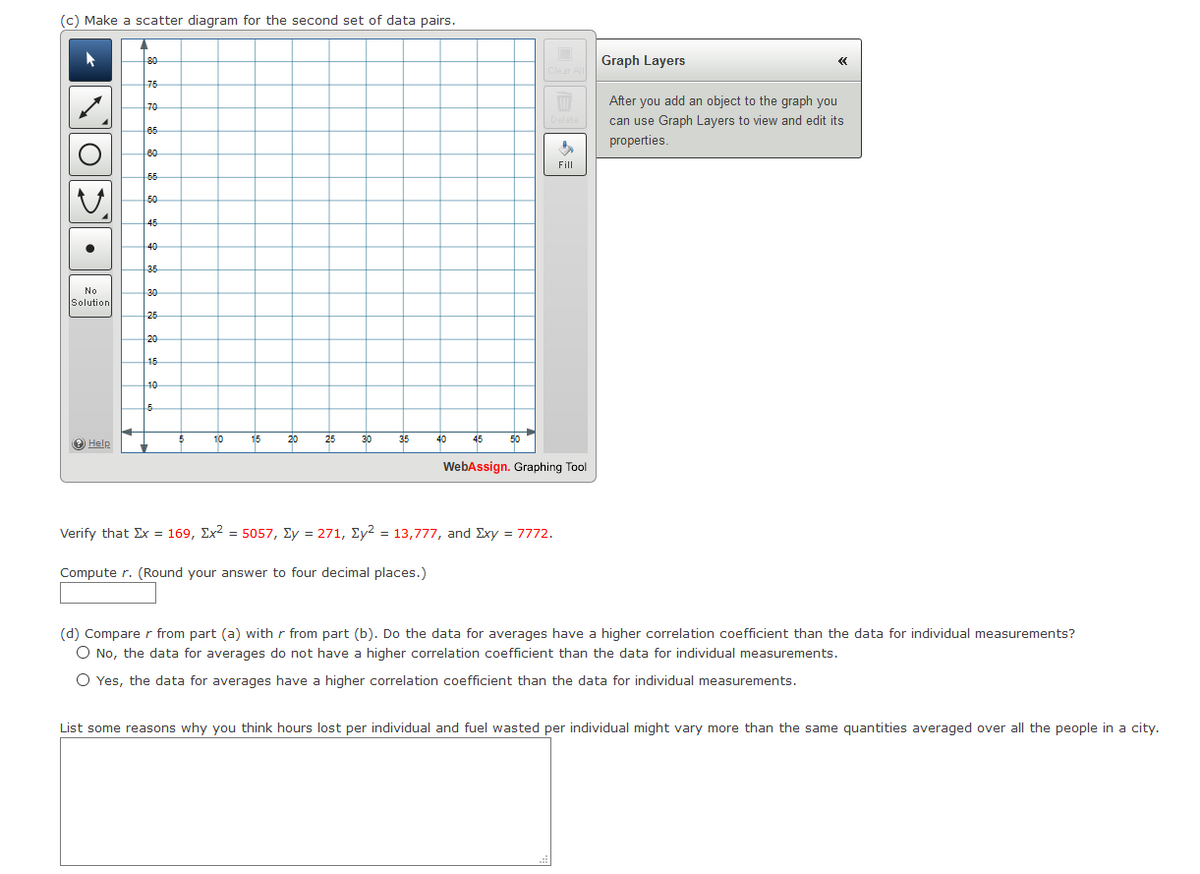
Look at the defining formula for r. Why do smaller standard deviations sx and sy tend to increase the value of r?
and (d) Compare r from part (a) with r from part (b). Do the data for averages have a higher
And
List some reasons why you think hours lost per individual and fuel wasted per individual might vary more than the same quantities averaged over all the people in a city.


Trending now
This is a popular solution!

Step by step
Solved in 3 steps with 3 images


