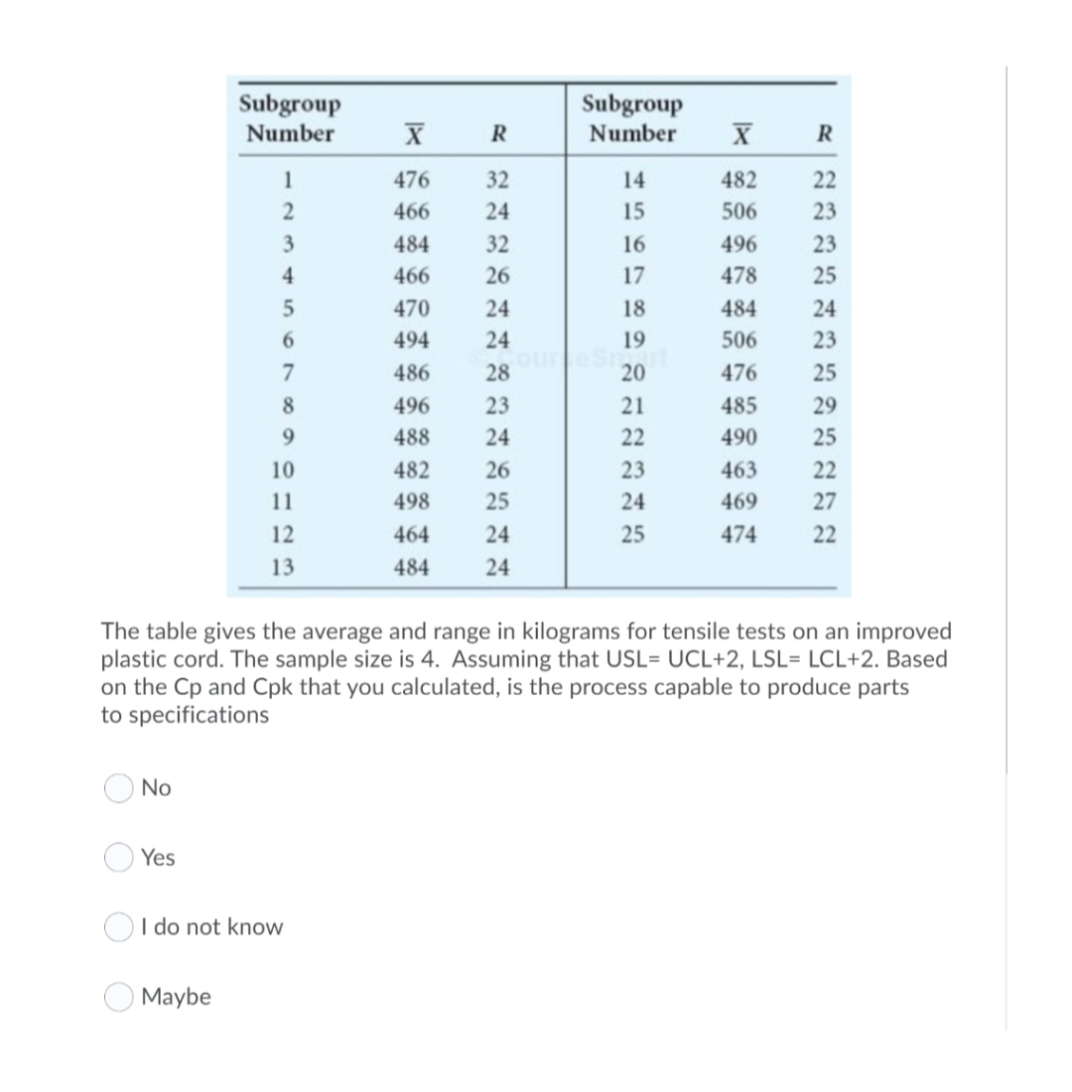
The table gives the average and range in kilograms for tensile tests on an improved plastic cord. The sample size is 4. Assuming that USL= UCL+2, LSL= LCL+2. Based on the Cp and Cpk that you calculated, is the process capable to produce parts to specifications


Q: Statistics is the interpretation of data. True O False
A: In this question given that statement "Statistics is the interpretation of data" Find out whether th...
Q: What does the correction for attenuation formula show? how reliable a test needs to be in order to h...
A: In this question statement and option is given We need to find right answer
Q: An efficient, unbiased point estimate of the mean number of books checked out each day at the Librar...
A: Interval estimate is given by (790, 970) Let M denote the point estimate and E denote the margin of ...
Q: Question 30 Ising the 2^ rule, determine the number of class intervals(k) for the frequency distribu...
A:
Q: Listed below are the numbers of hurricanes that occurred in each year in a certain region. The data ...
A:
Q: Does the relationship between the independent variable and the dependent variable changeas a functio...
A: Statistical relationship between two variables is referred to as the correlation.
Q: Dunkins Corporation would like to buy insurance for their employee. The distributions are as follows...
A: Given the data as Betty, Carol & Emily Fendy & Qalid Loss outcome Probability Loss outc...
Q: A binomial probability experiment is conducted with the given parameters. Compute the probability of...
A:
Q: The Women’s Institutional Studies group at a Midwestern university wanted to compare the percentages...
A: From the provided information,
Q: 6. For each situation, name the type of bias that may occur in the data collected. Explain your answ...
A: In any data collection method, there are some sources of bias. (a) A survey will not produce accurat...
Q: Students on an internship program in the US Fish and Wildlife Service wishes to test the nitrogen co...
A: The given sample mean is 2.6 and the population standard deviation is 0.3.
Q: According to Dietary Goals for the US (1977), high sodium intake may be related to ulcers, stomach c...
A: We have given that, Mean(x̄) = 238, standard deviation (s) = 8.3, sample size (n) = 9 and confidence...
Q: Chi-Square distribution having one (1) degree of freedom will be asymptotic on x-axis only True Fals...
A: We have given that the statement about to the Chi-Square distribution.
Q: Identify the distribution with the following moment generating functions (i) M, (t)= |0.3 +0.7e' ]" ...
A: It is known that the moment generating function uniquely identifies the corresponding distribution.
Q: Question 2 Classify the data as quantitative or qualitative? a) weights(in pounds) in a Gym class? ...
A:
Q: Consider a hypothetical study that suggests that job satisfaction predicts the extent to which emplo...
A: Variable : Any attribute, number, or amount that may be measured or counted is remarked as a variabl...
Q: There are two independent random variables X and Y. X has mean 4 and standard deviation , and Y also...
A:
Q: In a survey, 12 people were asked how much they spent on their child's last birthday gift. The resul...
A:
Q: Assume that a population of thousands of people whose responses were used to develop an anxiety test...
A:
Q: Assume that the random variable X is normally distributed, with mean u = 50 and standard deviation o...
A:
Q: Assume that a sample is used to estimate a population proportion p. Find the 95% confidence interval...
A: Given that n =227 ,x =129 Find the 95% confidence interval ? < p < ?
Q: Calculate a 95% confidence interval for the proportion p of individuals in the population for whom t...
A: Chinovac Labs tried a new vaccine on 148 randomly selected individuals. From the experiment, it was ...
Q: Not rejecting the null hypothesis when it is true would also mean that the alternative hypothesis is...
A: Null hypothesis Ho : Observed difference is due to chance ( it means that two possibilities are sa...
Q: A professor transforms their students' scores on a class assignment into a standardized distribution...
A: We have given that, A professor transforms their students scores on a class assignment into a stand...
Q: 国 The annual per capita consumption of bottled water was 30.5 gallons. Assume that the per capita co...
A: Given Data : Population Mean,μ = 30.5 Population Standard Deviation,σ = 13
Q: We poll 150 people and find that 40% favor Candidate S. In order to estimate with 99% confidence wha...
A: We have to estimate the percent of ALL voters would vote for Candidate S with 99% confidence. It is ...
Q: The cumulative probability of a Chi-Square distribution runs left to right. 0 is on the left, and 1 ...
A:
Q: Two couples (Adam/Brenda and Carl/Darlene) have bought tickets for four adjacent seats to see a mu...
A: Given,no.of women=2no.of men=2Total no.of people=4
Q: What should be your decision when P-value < a ? O There is not evidence to support Ha The test is in...
A:
Q: Confidence intervals on the variance is very sensitive on the nomality of the data while the confide...
A:
Q: In a case-control study researchers investigated whether there was an association between living nea...
A: Statistical Inference: Statistical inference is the process of drawing inferences about a population...
Q: a. What is the probability that Z is less than 1.06? The probability that Z is less than 1.06 is. (R...
A: Let Z denote the Std. Normal distribution i.e N(0,1) Note : According to our guidelines we are solvi...
Q: Question 1(a) The length, X, in cm of the leaf of the white sage plant has a N(u, o?) distribution. ...
A: Claim : The average length of the leaves of the white sage plant equal to 7 cm , i.e. μ = 7 Hypothe...
Q: A researcher surveyed 12 men who lost their fathers earlier in their lives. His survey included the...
A:
Q: The cumulative probability of a Chi-Square distribution runs left to right. 0 is on the right, and 1...
A: We have given that the statement about to the Chi-Square distribution. Note: According to Bart...
Q: Consider the following frequency table of 50 observations on the random variable X: Value 1 2 3 or m...
A: Given the, Frequency table of 50 observations on random variable X with significance level 0.05 and ...
Q: Test of u = 34 vs not = 34 Variable N Mean StDev SE Mean T P 16 35.274 1.783 a. b. 0.012 c. How many...
A: We have given that the One-sample T-test.
Q: One of these is the correlation coefficient above. Identify the correlation coefficient.
A: Here use correlation coefficient
Q: L_E_T Y and X be t_w_o discrete random variables whose joint p_r_o_bability function is given as sho...
A:
Q: Market researchers are interested in what convinces people to stay for a long time in a shop. If T i...
A:
Q: Suppose approximately 80% of all marketing personnel are extroverts, whereas about 55% all computer ...
A: Given that For Extrovert Probability =0.80 Number of observation =15 We have to find the probabili...
Q: 1. Interest centers around the life of an electronic component. Suppose it is known that the probabi...
A: Note- Since you have posted multiple questions, as per our guidelines we are supposed to answer only...
Q: A data set includes 105 body temperatures of healthy adult humans having a mean of 98.7°F and a stan...
A: Given X-bar=98.7 S=0.64 n=105
Q: 1) A study compared the weight loss of people on a low-fat diet versus people on a low-carb diet. In...
A: The population of a t-test follows a normal distribution.
Q: The following are the prices of commodities in 2016 and 2017. Calculate a price index based on price...
A: Index number is used to measure the change in price over a period of time. It is broadly classified ...
Q: Assume the random variable X is normally distributed with mean u= 50 and standard deviation o = 7. F...
A:
Q: From the following data construct a price index number of the group of four commodities by using the...
A:
Q: In an experiment, college students were given either four quarters or a $1 bill and they could eit...
A: Given Total number=88
Q: Table 1: Measurement of Total Phosphorus and Chlora Total P (ug/L) Chlorophyll a (ug/L) 10
A: Given:
Q: For a hypothesis Họ s40, H 40, the cumulaive probability that corresponds to the test statistic z is...
A: Solution-: Given: μ0=40,Zstat=z=0.8569 We have: H0:μ≤μ0=40 Vs H1:μ>40 (Right tailed test) ...


Trending now
This is a popular solution!

Step by step
Solved in 2 steps with 1 images

- What is a sample space?3.273525429 3.725058267 3.193881287 3.380595777 3.849062312 2.688788698 4.521501366 2.876926464 3.202865171 3.760862809 3.648737967 3.155042169 3.047772295 2.331491399 2.43426651 3.316262576 3.33570391 3.123784316 1.983014564 4.026381813 2.819851735 3.020835161 3.963952045 3.434812572 2.530150764 3.501124236 2.723868073 3.734018756 3.07485433 2.945439985 2.963046282 3.301251136 3.806637216 2.495620331 2.99022362 2.548798319 2.849586988 3.554039618 3.565046584 3.383944772 2.895875003 3.96006813 3.744978387 4.034873151 3.394484477 4.637022161 3.085000083 3.945715143 2.590540526 3.593019815 Data from sheet 5495745947949979437 x 7826736386487342622 - 1000000 x 634634662354 + 8766348764410939824383658 x 8483 + 636536425195805057509 + 64658659875963
- 3.273525 3.725058 3.193881 3.380596 3.849062 2.688789 4.521501 2.876926 3.202865 3.760863 3.648738 3.155042 3.047772 2.331491 2.434267 3.316263 3.335704 3.123784 1.983015 4.026382 2.819852 3.020835 3.963952 3.434813 2.530151 3.501124 2.723868 3.734019 3.074854 2.94544 2.963046 3.301251 3.806637 2.49562 2.990224 2.548798 2.849587 3.55404 3.565047 3.383945 2.895875 3.960068 3.744978 4.034873 3.394484 4.637022 3.085 3.945715 2.590541 3.59302 Spreadsheet 5Adams County, Nebraska 33,024 31,126 31,181 31,299 31,367 31,396 Antelope County, Nebraska 6,729 6,742 6,697 6,655 6,600 6,531 Arthur County, Nebraska 364 426 448 490 507 476 Banner County, Nebraska 824 720 703 778 816 788 Blaine County, Nebraska 471 539 585 584 586 594 Boone County, Nebraska 5,531 5,553 5,512 5,473 5,441 5,404 Box Butte County, Nebraska 11,031 11,372 11,383 11,345 11,312 11,308 Boyd County, Nebraska 2,120 2,107 2,095 2,025 2,093 2,067 Brown County, Nebraska 3,178 3,192 3,153 3,183 3,167 3,090 Buffalo County, Nebraska 44,877 45,437 45,842 46,330 46,885 47,388 Burt County, Nebraska 7,047 6,964 6,901 6,829 6,748 6,690 Butler County, Nebraska 8,416 8,382 8,360 8,345 8,334 8,312 Cass County, Nebraska 25,495 25,246 25,230 25,214 25,222 25,315 Cedar County, Nebraska 8,582 8,906 8,839 8,807 8,790 8,736 Chase County, Nebraska 3,702 3,927 3,937 3,964 3,984 3,990 Cherry County, Nebraska 5,682 5,783 5,750 5,722 5,735 5,749 Cheyenne County, Nebraska…Sale Price 12400 10400 12100 10000 11000 8895 7675 9975 6350 10470 9895 11250 8795 12500 9340 10150 9200 9395 11000 10640 10000 7500 8000 10440 10200 10300 9740 9280 10930 8000 9000 7680 9400 10730 7350 12240 11970 8240 9910 10080 9440 8970 9500 10050 10130 11400 8500 7500 9090 10500 According to the National Automobile Dealers Association, the mean price for used cars is $10,192. A manager of a Kansas City used car dealership reviewed a sample of 50 recent used car sales at the dealership in an attempt to determine whether the population mean price for used cars at this particular dealership differed from the national mean. The prices for the sample of 50 cars are shown in the file named UsedCars. Formulate the hypotheses that can be used to determine whether a difference exists in the mean price for used cars at the dealership. What is the p-value? At , what is your conclusion?
- hw 2 399.1 395 530.7 495.1 476.8 460.9 480.9 450.4 472.7 453.5 446.2 567.3 428.2 547.2 507.8 383 453.5 507.7 506 473.8 392.3 450.7 464.5 403.4 465.8 534.2 471.7 507.7 490.2 481.7 492.4 477.2 507.7 476.8 464.7 390.2 481.7 469 515.7 519.4 396.3 517.2 493.9 515.2 486.5 460.3 475.4 445.5 467.7 531 532.7 486.4 533.8 453.5 Find the first quartile for this data set.Q1 = Find the third quartile for this data set.Q3 = Find the interquartile range for this data set. IQR =Company Competitor 1383 1153 2022 1067 2429 1296 901 1406 2219 1254 1896 1335 1910 1204 1539 1076 2048 1246 2881 1098 2395 1258 1349 955 2052 954 2675 1363 1588 1022 2704 1155 3148 1807 2822 1295 2217 1116 2260 1323 3040 1326 3137 1107 2977 1163 2599 1254 2412 1017 3187 938 2598 1270 2995 1042 3046 1318 3858 1497 2438 750 3243 1380 2764 1053 2944 932 3324 1097 2797 1193 3914 1271 2766 843 2273 780 3052 1095 3202 1290 3672 937 3957 1390 3274 1056 3788 1235 3502 1235 2942 999 3078 1066 3196 641 3141 1322 3579 1289 3895 1060 above is the excel data, please solve the excel part with formulas and explanation, thanks775 1065 896 930 1052 846 949 797 1041 962 1028 910 1067 982 879 1097 1071 1056 1021 928 1045 974 1112 975 887 1069 1040 927 867 864 983 987 906 1030 934 662 1004 901 1123 1033 1028 934 1148 1027 978 1139 1078 1088 948 912 942 860 822 911 938 1000 944 980 915 899 852 989 978 991 996 878 833 865 1069 779 960 907 1009 1118 903 957 1014 885 947 1006 1036 824 866 860 986 972 916 991 851 1050 980 983 977 864 903 940 995 842 1122 1036 The table above represents the average rent for 100 randomly selected U.S. cities. According to www.apartments.com, the average rent for a two-bedroom apartment in the city of Napa is $1,967. How do other U.S. cities’ rents compare to Napa? Are they about the same, on average, or are rents significantly lower elsewhere? 1) To test this hypothesis, two…
- 775 1065 896 930 1052 846 949 797 1041 962 1028 910 1067 982 879 1097 1071 1056 1021 928 1045 974 1112 975 887 1069 1040 927 867 864 983 987 906 1030 934 662 1004 901 1123 1033 1028 934 1148 1027 978 1139 1078 1088 948 912 942 860 822 911 938 1000 944 980 915 899 852 989 978 991 996 878 833 865 1069 779 960 907 1009 1118 903 957 1014 885 947 1006 1036 824 866 860 986 972 916 991 851 1050 980 983 977 864 903 940 995 842 1122 1036 The above table represents the average rent for 100 randomly selected U.S. cities. According to www.apartments.com, the average rent for a two-bedroom apartment in the city of Napa is $1,967. How do other U.S. cities’ rents compare to Napa? Are they about the same, on average, or are rents significantly lower elsewhere? 1) Set up the hypotheses (null and…The annual salary for a sample of U.S. governors in 2017 are as follows: $120395, $177467, $130273, $139339, $177412, $99636, $150000, $159300, $123427, $108167, $149730, $110834, $105000, $142265, $148886, $98600, $106078, $109470, $160135, $175000, $150000, $105000. 1. Find the mean and the standard deviation for the sample of annual salaries. 2. What is the associated t - score for a 99% confidence level? 3. What is the margin of error for a confidence level of 99%? 4. Find a 99% confidence interval for the mean salary of U.S. governors in 2017. Assume the data is normally distributed.Male Female27,329 22,49814,596 24,5893,890 5,06827,315 16,72525,067 10,3808,480 16,57219,490 10,75516,334 19,12228,183 11,82721,356 18,61212,674 15,73210,066 11,42311,288 17,79220,679 24,76719,722 6,359369 19,57118,284 21,81211,653 19,68618,981 18,29415,412 13,48515,839 31,24320,391 9,4316,069 16,1216,072 4,22624,527 12,6649,492 20,22511,618 14,59813,916 22,04613,081 20,08517,460 11,13913,491 35,7097,630 8,54121,263 9,82216,455 12,38511,590 28,05515,409 19,22816,827 16,21710,596 17,72618,005 20,00612,428 16,58313,727 19,8574,706 14,49917,168 17,97412,641 17,22015,661 28,75616,855 38,40718,490 25,78537,993 33,38319,196 25,06447,688 30,26225,062 18,14310,357 7,59515,653 23,8969,962 16,4425,377 16,53619,537 26,129