Gaming and distracted eating, Part I: A group of researchers are interested in the possible effects of distracting stimuli during eating, such as an increase or decrease in the amount of food consumption. To test this hypothesis, they monitored food intake for a group of 44 patients who were randomized into two equal groups. The treatment group ate lunch while playing solitaire, and the control group ate lunch without any added distractions. Patients in the treatment group ate 52.1 grams of biscuits, with a standard deviation of 45.1 grams, and patients in the control group ate 27.1 grams of biscuits, with a standard deviation of 26.4 grams. Do these data provide convincing evidence that the average food intake (measured in amount of biscuits consumed) is different for the patients in the treatment group? Assume that conditions for inference are satisfied. Use the treatment group as Group A and the control group as Group B. What are the hypotheses for this test? O Ho: Uno distraction = Hdistraction Ha: Hno distraction < Hdistraction O Ho: Uno distraction = Hdistraction Ha: Hno distraction > Hdistraction م Ho: Hno distraction = Hdistraction Ha: Hno distraction * Hdistraction The degrees of freedom associated with this test are: 42 X The test statistic for the hypothesis test is (round your answer to 3 decimal places): 2.24
Gaming and distracted eating, Part I: A group of researchers are interested in the possible effects of distracting stimuli during eating, such as an increase or decrease in the amount of food consumption. To test this hypothesis, they monitored food intake for a group of 44 patients who were randomized into two equal groups. The treatment group ate lunch while playing solitaire, and the control group ate lunch without any added distractions. Patients in the treatment group ate 52.1 grams of biscuits, with a standard deviation of 45.1 grams, and patients in the control group ate 27.1 grams of biscuits, with a standard deviation of 26.4 grams. Do these data provide convincing evidence that the average food intake (measured in amount of biscuits consumed) is different for the patients in the treatment group? Assume that conditions for inference are satisfied. Use the treatment group as Group A and the control group as Group B. What are the hypotheses for this test? O Ho: Uno distraction = Hdistraction Ha: Hno distraction < Hdistraction O Ho: Uno distraction = Hdistraction Ha: Hno distraction > Hdistraction م Ho: Hno distraction = Hdistraction Ha: Hno distraction * Hdistraction The degrees of freedom associated with this test are: 42 X The test statistic for the hypothesis test is (round your answer to 3 decimal places): 2.24

Holt Mcdougal Larson Pre-algebra: Student Edition 2012
1st Edition
ISBN:9780547587776
Author:HOLT MCDOUGAL
Publisher:HOLT MCDOUGAL
Chapter11: Data Analysis And Probability
Section: Chapter Questions
Problem 8CR

Related questions
Question
How do I find the degrees of freedom?
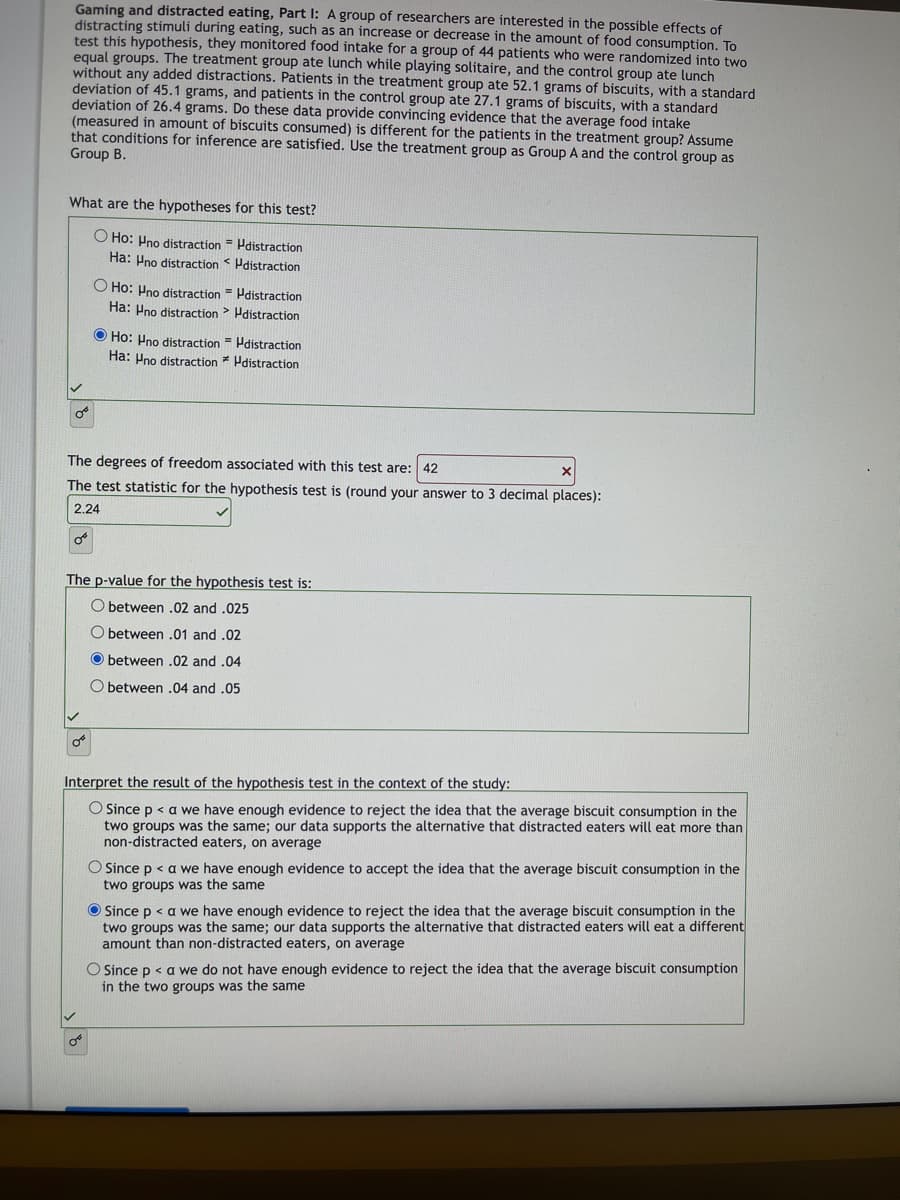
Transcribed Image Text:Gaming and distracted eating, Part I: A group of researchers are interested in the possible effects of
distracting stimuli during eating, such as an increase or decrease in the amount of food consumption. To
test this hypothesis, they monitored food intake for a group of 44 patients who were randomized into two
equal groups. The treatment group ate lunch while playing solitaire, and the control group ate lunch
without any added distractions. Patients in the treatment group ate 52.1 grams of biscuits, with a standard
deviation of 45.1 grams, and patients in the control group ate 27.1 grams of biscuits, with a standard
deviation of 26.4 grams. Do these data provide convincing evidence that the average food intake
(measured in amount of biscuits consumed) is different for the patients in the treatment group? Assume
that conditions for inference are satisfied. Use the treatment group as Group A and the control group as
Group B.
What are the hypotheses for this test?
O Ho: Hno distraction = Hdistraction
Ha: Hno distraction < Hdistraction
O
O Ho: Pno distraction = Hdistraction
Ha: Hno distraction > Hdistraction
Ho: Hno distraction = Hdistraction
Ha: Hno distraction distraction
The degrees of freedom associated with this test are: 42
X
The test statistic for the hypothesis test is (round your answer to 3 decimal places):
2.24
0°
The p-value for the hypothesis test is:
O between .02 and .025
O between .01 and .02
Obetween .02 and .04
O between .04 and .05
Interpret the result of the hypothesis test in the context of the study:
O Since p < a we have enough evidence to reject the idea that the average biscuit consumption in the
two groups was the same; our data supports the alternative that distracted eaters will eat more than
non-distracted eaters, on average
O Since p < a we have enough evidence to accept the idea that the average biscuit consumption in the
two groups was the same
Since p < a we have enough evidence to reject the idea that the average biscuit consumption in the
two groups was the same; our data supports the alternative that distracted eaters will eat a different
amount than non-distracted eaters, on average
O Since p < a we do not have enough evidence to reject the idea that the average biscuit consumption
in the two groups was the same
Expert Solution
This question has been solved!
Explore an expertly crafted, step-by-step solution for a thorough understanding of key concepts.

This is a popular solution!

Trending now
This is a popular solution!

Step by step
Solved in 2 steps

Recommended textbooks for you
Holt Mcdougal Larson Pre-algebra: Student Edition…
Algebra
ISBN:
9780547587776
Author:
HOLT MCDOUGAL
Publisher:
HOLT MCDOUGAL


College Algebra (MindTap Course List)
Algebra
ISBN:
9781305652231
Author:
R. David Gustafson, Jeff Hughes
Publisher:
Cengage Learning
Holt Mcdougal Larson Pre-algebra: Student Edition…
Algebra
ISBN:
9780547587776
Author:
HOLT MCDOUGAL
Publisher:
HOLT MCDOUGAL
College Algebra (MindTap Course List)
Algebra
ISBN:
9781305652231
Author:
R. David Gustafson, Jeff Hughes
Publisher:
Cengage Learning
