
Chapter20: Growth And Less Developed Countries
Section: Chapter Questions
Problem 19SQ

Related questions
Question
According to the pictures
How have the variables performed relative to each other?
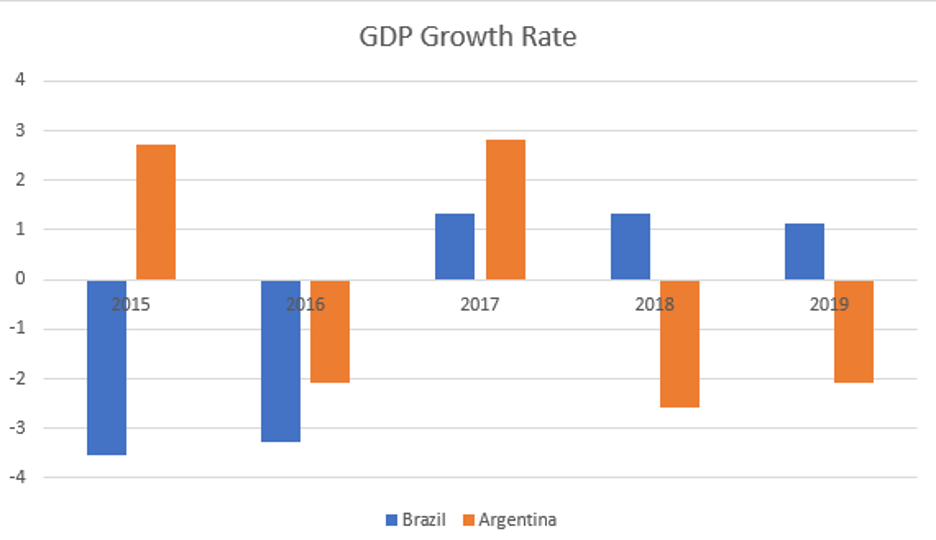
Transcribed Image Text:GDP Growth Rate
4
3
2
2015
2016
2017
2018
2019
-1
-2
-3
-4
1 Brazil IArgentina
1.
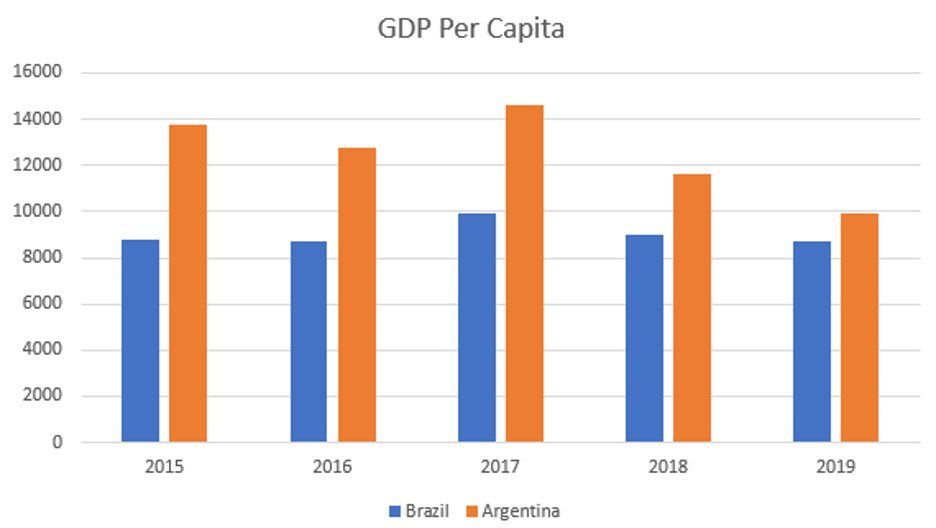
Transcribed Image Text:GDP Per Capita
16000
14000
12000
10000
8000
6000
4000
2000
2015
2016
2017
2018
2019
| Brazil 1Argentina
Expert Solution
This question has been solved!
Explore an expertly crafted, step-by-step solution for a thorough understanding of key concepts.

Step by step
Solved in 2 steps

Knowledge Booster


Learn more about
Need a deep-dive on the concept behind this application? Look no further. Learn more about this topic, economics and related others by exploring similar questions and additional content below.Recommended textbooks for you


Principles of Economics 2e
Economics
ISBN:
9781947172364
Author:
Steven A. Greenlaw; David Shapiro
Publisher:
OpenStax