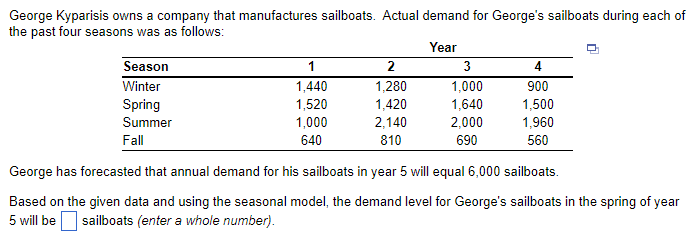
George Kyparisis owns a company that manufactures sailboats. Actual demand for George's sailboats during each of the past four seasons was as follows: Year Season Winter Spring Summer Fall 1 1,440 1,520 1,000 640 2 1,280 1,420 2,140 810 3 1,000 1,640 2,000 690 4 900 1,500 1,960 560 George has forecasted that annual demand for his sailboats in year 5 will equal 6,000 sailboats. Based on the given data and using the seasonal model, the demand level for George's sailboats in the spring of year 5 will be sailboats (enter a whole number).
Q: What advantages can project management collaboration tools offer?
A: Project management collaboration tool is a software system which facilitate the effective…
Q: Discuss the major influences that Operations has on Competitiveness.
A: Organizations should be competitive to sell their products and services in the market.…
Q: What elements of Shortest Job First Scheduling and Priority Scheduling are comparable?
A: Priority Scheduling The procedures are carried out in order of priority using a priority scheduling…
Q: Your Lego furniture company makes Tables and Chairs. Below, you are given the starting inventory,…
A: Let Table = T and Chair = C For scenrio 3 maximize revenue = 19 T + 19 C subject to 2T +…
Q: A decorating store specializing in do-it-your-self home decorators must decide how many informa-…
A: In mathematics, linear programming is indeed a technique for maximizing actions under certain…
Q: RMC, Inc., is a small firm that produces a variety of chemical products. In a particular production…
A: Let x be the fuel additive Produced Let y be the solvent base produced Objective function : Max Z…
Q: Product X currently sells for $12 per unit. The variable costs is $4 per unit and 10,000 units are…
A: Break even point is a point at which the company's production cost and production revenue are equal.
Q: 4) A 12-ounce box of Greenies costs $12.99. A 30-ounce box costs $26.99. (a) What is the cost in…
A: “Since you have posted a question with multiple sub-parts, we will solve the first three sub-parts…
Q: Metropolitan Manila has four incinerator sites for processing solid waste. There are five garbage…
A: Given data is
Q: Wheels Distributors sells three types of tires to the commercial market. Type A. Type B and Type…
A: The expected value of perfect information is the price that one would be willing to pay in order to…
Q: Calculate the ES, EF, LS, and LF times and the slack for each activity in the figure below, and…
A: A network diagram related to the project shows the sequence of the task that is performed to…
Q: The Economic Order Quantity (EOQ) model is a classical model used for controlling inventory and…
A:
Q: What are some examples of code of conduct?
A: The term code of conduct can be understood as a couple of principals which are laid down by the…
Q: Mark Gershon, owner of a musical instrument distributorship, thinks that demand for guitars may be…
A: Using least Square method Marron 5 TV appearancr(X) Demand for Guitars(Y X^2 Y^2 XY 3 4 9 16…
Q: Consider the following actual and forecast demand levels for Big Mac hamburgers at a local…
A: Given data is Alpha = 0.25
Q: Discuss a company that is known to be a low-cost producer in its industry and consider why it is a…
A: Low producers can be stated as the term that is used in the business sector and industries to define…
Q: An electronics manufacturer is introducing seven new electronic products. Each of its eight plants…
A: Given data is
Q: A company uses to chemicals (1 and 2) to manufacture two drugs. Drug 1 must be at least 60% chemical…
A: Objective Functions and Constraints: Based on the given details, the objective…
Q: A Mercedes dealer pays $40,000 for each car purchased (wholesale price). The annual holding cost is…
A:
Q: Problem 2-3 (Algo) Compute the multifactor productivity measure for each of the weeks shown for…
A: Weekly hour = 40 Hourly wage = $16 Labor cost(L) = 40 x $16 = $640 Overhead cost = $1.5 times…
Q: 4. Simple Exponential Smoothing: Use a smoothing parameter, α = 0.3. Month Ft 1 2 3 4 5 678 9 10 No.…
A: Exponential smoothing is a forecasting model which using the actual demand and forecasting f=demand…
Q: Nancy says to Kip, "When you authorized the discounts, I never heard all the details. Do you mind…
A: Note- Hi! Thank you for the question As per the honour code, We’ll answer the first question since…
Q: 60 SECURITY (Percent of terrorists caught) 8 4 5 0 0 True 30 60 TOURISM (Millions of visitors) 90…
A: Ans) Graph Explanation: The graph is between security and Tourism. With the decrease in security,…
Q: a. What is the alternative that provides the factory the greatest expected value and what is the EV…
A: Here, from the table, we could see that there are three approaches, Increased capacity, used…
Q: The MAD for Method 1 = enter your response here thousand gallons (round your response to three…
A: Forecasting is a technique used to predict future outcomes on the basis of past data. In business…
Q: What is the unemployment in the region?
A: The Above Question can be solved by probablistic sampling:
Q: What is the importance of the production efficiency in a business?
A: Production efficiency refers to the lowest cost of producing one unit that can be achieved with the…
Q: QUESTION 1: A confectioner buys plastic boxes in bulk and uses them to pack chocolates. The annual…
A: Annual demand(D) = 1200 Cost = 30 Holding cost(H) = 20%*30 = 6 Ordering cost(O) = 10 Calculate…
Q: Pharasalia skincare Inc. has developed a new lotion that will help to improve skin ageing. Total…
A: Cost category Amount Product recalls $ 625,000 Downtime due to defects $ 600,000…
Q: During the Performance Testing phase of a project, what kind of mistakes could occur?
A: A combination of procedures and actions aimed at enhancing performance are called Performance…
Q: a) Based on the activity time estimates, the expected times and variance for each of the…
A: A network diagram related to the project shows the sequence of the task that is performed to…
Q: W = jars of Western Foods Salsa M = jars of Mexico City Salsa leads to the formulation (units for…
A: As per Bartleby guidelines, we can only solve the first three subparts of one question at a…
Q: A foundry receives an order for four custom-designed castings. The customer will pay $30,000 for…
A:
Q: Brown's, a local bakery, is worried about increased costs particularly energy. Last year's records…
A: Productivity is the ability to produce in an effective and efficient manner in an organisation.
Q: Problem 13-11 (Algorithmic) Following is the payoff table for the Pittsburgh Development…
A: Decision alternative Strong Demand (S1) (million $) Weak Demand (S2) (million $) Small Complex…
Q: QUESTION 1 FILL IN THE BLANK Stimulus-Response-Feedback is a method used in _________ analysis.
A: Note-Hi! Thank you for the question As per the honour code, We’ll answer the first question since…
Q: preparation process.
A: The ‘Production Preparation Process’ is a powerful way of taking a big-picture glimpse at how a…
Q: Your Lego furniture company makes Tables and Chairs. Below, you are given the starting inventory,…
A: The question stated to use scenario 2.
Q: KVS Pharmacy fills prescriptions for a popular children’santibiotic, Amoxycilin. The daily demand…
A: Given data Average daily demand (d) = 200 ounces Standard deviation (σ)= 80 ounces Review period…
Q: At syntecks, the output of a specific process is valued at $100 per unit. The cost of labor is $50…
A: Week 1 Week 2 Week 3 Week 4 Labor $12735 $14842 $10603 $9526 Material $21041 $24523 $20442…
Q: Discuss the following objectives in relation of tactical logistics management: 1.1.2 Improved…
A: Tactical logistics management can be stated as the approach that generally focuses on the particular…
Q: How can the production of a product could be made more efficient
A: Productive of desired effects especially: capable of producing the desired result with…
Q: Explain the limitations of the Gantt Cart as a a planning tool.
A: One of the most well-liked and helpful projects management tools is the Gantt chart, which depicts…
Q: During the implementation stage, the Fallon creative team works with Fallon media buyers to select…
A: In house agency : A brand's internal team that is responsible for marketing and advertising its…
Q: what would make the biggest impact on organizational culture: a new code of conduct, a new hiring…
A: Organizational Culture:- The self-perception of employees, internal processes, contacts with the…
Q: A careful analysis of the cost of operating an automobile was conducted by accounting manager Dia…
A: Solution Model y = 4000+0.20x Annual cost = y Miles drive = x Given that, x = 15000
Q: Name four process controls and their importance.
A: Process Control Power plants, chemical plants, the food and beverage sector, paper mills, and oil…
Q: Figure 8.4 Sample Wall Street Journal U.S. Treasury Bond Prices Maturity 11/15/2018 3/31/2019…
A: According to the figure 8.4 table Maturity Coupon Bid Asked Chg Asked yield 11/15/2042 2.75…
Q: Use the data below to solve for the following: 2. Naïve method 3. Unweighted 3 month moving average…
A: 2. Naïve techniqueThe simplest form of forecasting, the naive method forecasts that the value in the…
Q: What distinguishes the nature of hospitality and tourism facilities?
A: Introduction: The phrase "hospitality" refers to the practice of welcoming guests and providing for…
Practice 11. Please show solution. Thank you.
Trending now
This is a popular solution!
Step by step
Solved in 3 steps
- The Baker Company wants to develop a budget to predict how overhead costs vary with activity levels. Management is trying to decide whether direct labor hours (DLH) or units produced is the better measure of activity for the firm. Monthly data for the preceding 24 months appear in the file P13_40.xlsx. Use regression analysis to determine which measure, DLH or Units (or both), should be used for the budget. How would the regression equation be used to obtain the budget for the firms overhead costs?The file P13_29.xlsx contains monthly time series data for total U.S. retail sales of building materials (which includes retail sales of building materials, hardware and garden supply stores, and mobile home dealers). a. Is seasonality present in these data? If so, characterize the seasonality pattern. b. Use Winters method to forecast this series with smoothing constants = = 0.1 and = 0.3. Does the forecast series seem to track the seasonal pattern well? What are your forecasts for the next 12 months?The owner of a restaurant in Bloomington, Indiana, has recorded sales data for the past 19 years. He has also recorded data on potentially relevant variables. The data are listed in the file P13_17.xlsx. a. Estimate a simple regression equation involving annual sales (the dependent variable) and the size of the population residing within 10 miles of the restaurant (the explanatory variable). Interpret R-square for this regression. b. Add another explanatory variableannual advertising expendituresto the regression equation in part a. Estimate and interpret this expanded equation. How does the R-square value for this multiple regression equation compare to that of the simple regression equation estimated in part a? Explain any difference between the two R-square values. How can you use the adjusted R-squares for a comparison of the two equations? c. Add one more explanatory variable to the multiple regression equation estimated in part b. In particular, estimate and interpret the coefficients of a multiple regression equation that includes the previous years advertising expenditure. How does the inclusion of this third explanatory variable affect the R-square, compared to the corresponding values for the equation of part b? Explain any changes in this value. What does the adjusted R-square for the new equation tell you?
- The file P13_42.xlsx contains monthly data on consumer revolving credit (in millions of dollars) through credit unions. a. Use these data to forecast consumer revolving credit through credit unions for the next 12 months. Do it in two ways. First, fit an exponential trend to the series. Second, use Holts method with optimized smoothing constants. b. Which of these two methods appears to provide the best forecasts? Answer by comparing their MAPE values.The file P13_28.xlsx contains monthly retail sales of U.S. liquor stores. a. Is seasonality present in these data? If so, characterize the seasonality pattern. b. Use Winters method to forecast this series with smoothing constants = = 0.1 and = 0.3. Does the forecast series seem to track the seasonal pattern well? What are your forecasts for the next 12 months?The file P13_02.xlsx contains five years of monthly data on sales (number of units sold) for a particular company. The company suspects that except for random noise, its sales are growing by a constant percentage each month and will continue to do so for at least the near future. a. Explain briefly whether the plot of the series visually supports the companys suspicion. b. By what percentage are sales increasing each month? c. What is the MAPE for the forecast model in part b? In words, what does it measure? Considering its magnitude, does the model seem to be doing a good job? d. In words, how does the model make forecasts for future months? Specifically, given the forecast value for the last month in the data set, what simple arithmetic could you use to obtain forecasts for the next few months?
- Suppose that a regional express delivery service company wants to estimate the cost of shipping a package (Y) as a function of cargo type, where cargo type includes the following possibilities: fragile, semifragile, and durable. Costs for 15 randomly chosen packages of approximately the same weight and same distance shipped, but of different cargo types, are provided in the file P13_16.xlsx. a. Estimate a regression equation using the given sample data, and interpret the estimated regression coefficients. b. According to the estimated regression equation, which cargo type is the most costly to ship? Which cargo type is the least costly to ship? c. How well does the estimated equation fit the given sample data? How might the fit be improved? d. Given the estimated regression equation, predict the cost of shipping a package with semifragile cargo.A small computer chip manufacturer wants to forecast monthly ozperating costs as a function of the number of units produced during a month. The company has collected the 16 months of data in the file P13_34.xlsx. a. Determine an equation that can be used to predict monthly production costs from units produced. Are there any outliers? b. How could the regression line obtained in part a be used to determine whether the company was efficient or inefficient during any particular month?The management of a technology company is trying to determine the variable that best explains the variation of employee salaries using a sample of 52 full-time employees; see the file P13_08.xlsx. Estimate simple linear regression equations to identify which of the following has the strongest linear relationship with annual salary: the employees gender, age, number of years of relevant work experience prior to employment at the company, number of years of employment at the company, or number of years of post secondary education. Provide support for your conclusion.
- The file P13_26.xlsx contains the monthly number of airline tickets sold by the CareFree Travel Agency. a. Create a time series chart of the data. Based on what you see, which of the exponential smoothing models do you think will provide the best forecasting model? Why? b. Use simple exponential smoothing to forecast these data, using a smoothing constant of 0.1. c. Repeat part b, but search for the smoothing constant that makes RMSE as small as possible. Does it make much of an improvement over the model in part b?The file P13_22.xlsx contains total monthly U.S. retail sales data. While holding out the final six months of observations for validation purposes, use the method of moving averages with a carefully chosen span to forecast U.S. retail sales in the next year. Comment on the performance of your model. What makes this time series more challenging to forecast?Stock market analysts are continually looking for reliable predictors of stock prices. Consider the problem of modeling the price per share of electric utility stocks (Y). Two variables thought to influence this stock price are return on average equity (X1) and annual dividend rate (X2). The stock price, returns on equity, and dividend rates on a randomly selected day for 16 electric utility stocks are provided in the file P13_15.xlsx. Estimate a multiple regression equation using the given data. Interpret each of the estimated regression coefficients. Also, interpret the standard error of estimate and the R-square value for these data.