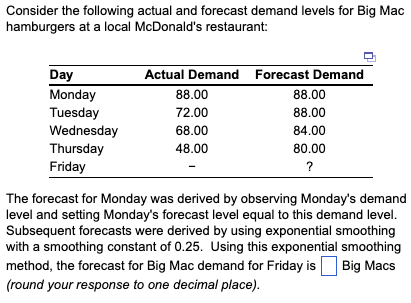
Consider the following actual and forecast demand levels for Big Mac hamburgers at a local McDonald's restaurant: Day Monday Tuesday Wednesday Thursday Friday Actual Demand Forecast Demand 88.00 72.00 68.00 48.00 88.00 88.00 84.00 80.00 ? The forecast for Monday was derived by observing Monday's demand level and setting Monday's forecast level equal to this demand level. Subsequent forecasts were derived by using exponential smoothing with a smoothing constant of 0.25. Using this exponential smoothing method, the forecast for Big Mac demand for Friday is Big Macs (round your response to one decimal place).
Q: What are the benefits of a multi-generational workforce? What are the challenges?
A: A multi-generation workforce can be stated as the personnel consisting of individuals from different…
Q: A local restaurateur, Cho Senn, is considering three options for his new Asian fusi restaurant.…
A: Given data, For Option A, the annual fixed cost=42500 the variable cost per customer=3.45 For…
Q: what do you think is the importance of using linear programming in achieving the work individual…
A: Linear programming can be stated as the technique of advancing or optimizing different operations…
Q: Problem 2-3 (Algo) Compute the multifactor productivity measure for each of the weeks shown for…
A: Weekly hour = 40 Hourly wage = $16 Labor cost(L) = 40 x $16 = $640 Overhead cost = $1.5 times…
Q: An assembly department has six jobs waiting to be processed. It is now time zero and all jobs are…
A:
Q: Is the following question slanted toward a desired response? If so, how? In view of escalating…
A: The given case might be the case that utilizes the outcomes from the survey to achieve information…
Q: mplications of safety stock and reorder poin
A: Safety stock is a concept that has been around for a few decades. It was first introduced as…
Q: The company aimed to define a global digital operations' strategy that would help them to be a first…
A: Operations management is a wide field because it has a very large process chain. The process chain…
Q: A catering company prepared and served 350 meals at an anniversary celebration last week using 10…
A: Given: The catering company prepared and served items on the anniversary =350 meals Labour…
Q: Every year, volunteers administer flu vaccine shots at a Medical Centre. The process involves four…
A: a) From the above given information, Capacity = Time available÷Cycle time in minutes…
Q: How can the information security strategy of a corporation be translated into a project plan for…
A: Business keeps their information secret and inaccessible to anyone without proper authorization.…
Q: Problem 2-3 (Algo) Compute the multifactor productivity measure for each of the weeks shown for…
A: Multifactor productivity = Output/Cost Cost = Wage cost + Overhead cost + Material cost Wage…
Q: Your Lego furniture company makes Tables and Chairs. Below, you are given the starting inventory,…
A: Let Table = T and Chair = C For scenrio 3 maximize revenue = 19 T + 19 C subject to 2T +…
Q: 4. Simple Exponential Smoothing: Use a smoothing parameter, α = 0.3. Month Ft 1 2 3 4 5 678 9 10 No.…
A: Exponential smoothing is a forecasting model which using the actual demand and forecasting f=demand…
Q: You have a new job as a Financial Planning assistant. Your client wants to invest money in stocks,…
A: Objective Functions and Constraints (Scenario 2): Based on the given details, the…
Q: Describe how project management software packages can help with project scheduling. Please respond…
A: Project management software is used to plan, organize, and allocate project resources. It…
Q: Why are services and manufacturing is important in connection with operations management
A: Operations management is a field that deals with many processes, people, tasks, and goals. Due to…
Q: ● A company produces three products A, B, C. For manufacturing three raw materials P, Q and R are…
A: Decision variables: Suppose-X = No. of units of A to be produced by the companyY = No. of units of…
Q: Consider the relationship chart for the a fast-food restaurant, Assume that the areas required for…
A: Code Closeness rating A Absolutely necessary E Especially important I Important O Ordinary…
Q: A Company is interested in developing a quarterly aggregate production plan but they are not sure if…
A: Given info- Hiring Cost= $40 per unitLayoff Cost = $80 per unitInventory holding Cost = $40 per…
Q: summarize the purpose and benefits of customer service.
A: Customer service:- The providing of service to customers before, during, and after the purchase of…
Q: The following table shows the actual demand observed over the last 11 years:…
A:
Q: Describe how to conduct a customer and team post-project review.
A: Post- project reviews:- Post-project reviews are an important part of the overall project management…
Q: 3. ND: Referring to the Z-Table, calculate the probability that each alternative will turn out at…
A: Find the Given details below: Given details: Alternatives States of Nature Recession…
Q: A decorating store specializing in do-it-your-self home decorators must decide how many informa-…
A: In mathematics, linear programming is indeed a technique for maximizing actions under certain…
Q: What is the minimum cost of crashing the following project that Roger Solano manages at Slippery…
A: Activity Normal time (days) Crashed time (days) Normal cost Crashed cost Predecessor 1 A 6 5 800…
Q: Daily high temperatures in St. Louis for the last week were as follows: 92, 94, 93, 92, 97,…
A: Using 3- day moving average Day Temperature calculation 3-day moving average 1 92 2 94…
Q: What is one thing you know about Operations Management and one thing you would like to learn
A: Operation management often called OM is nothing but the field of the business that is generally…
Q: Why do people do things that are unethical?
A: Ethics can be defined as the set of principles that direct toward those acts which are socially…
Q: The actual number of patients at Providence Emergency Medical Clinic for the first six weeks of this…
A: MAD is the average value of absolute errors and absolute value of the positive values identified in…
Q: The set-up time for a large press is 5 hours. A total of 15,000 units of a component is required…
A: Given data is Annual demand(D) = 15000 units Setup time = 5 hours Value per unit = $7.50 Holding…
Q: Use the data below to solve for the following: 2. Naïve method 3. Unweighted 3 month moving average…
A: 2. Naïve methodThe naïve method is the simplest forecasting method and just predicts that the value…
Q: An operation has a scrap rate of 15%. As a result, 102 sellable pieces per hour are produced. a.…
A: Scrap rate = 15% Better production = (100%-15%) Better production = 85% or 0.85 Hourly production =…
Q: MI’s Pulse of the Profession Reportin 2016states that Organizations waste $97 million for every $1…
A: Formed in 1969, Project Management Institute (PMI) is not-for-profit professional organization…
Q: The Westchester Chamber of Commerce periodically sponsors public service seminars and programs.…
A:
Q: Innis Investments manages funds for a number of companies and wealthy clients. The investment…
A: The following computer solution (Sensitivity report) is provided for the question:
Q: he manager of a crew that installs carpeting has tracked the crew’s output over the past several…
A: Calculate Labor productivity Formula = Yards/Crew size Week Crew Size Yards Labor productivity…
Q: What is the minimum cost of crashing the following project that Roger Solano manages at Slippery…
A: Activity Normal time (days) Crashed time (days) Normal cost Crashed cost Predecessor 1 A 6 5 900…
Q: a. Develop, for each department and day, the capacity requirements for each product and the total…
A: Scheduling is the process of arranging production activities in order to complete the manufacturing…
Q: GENERATE THE DECISION VARIABLE SOLUTION AND GENERATE A SENSITIVITY REPORT CASE 1. Julia's Food Booth…
A: Linear programming is a mathematical technique that is commonly used in operations management…
Q: Activity times for a project are estimated by all except which of the following methods? a. the use…
A: Project estimation can be stated as the approach of analyzing the data that is available to the…
Q: Describe the importance of Transportation.
A: In supply chain and operations transportation is the medium for any process to begin or finish.…
Q: Operations or operations management is not only about creating tangible goods in the business…
A: Production management is described as the method through which various activities in a business…
Q: The Ace Manufacturing Company has orders for three similar products. Orders (units) Product Min A…
A: Given data is
Q: QUESTION 20 Currently, the average time between failures of a part is 100 hours and the average…
A: Solution
Q: Based on the activity time estimates, the expected times for each of the activities are (round…
A: A network diagram related to the project shows the sequence of the task that is performed to…
Q: Use the data below to solve for the following: 2. Naïve method 3. Unweighted 3 month moving average…
A: Note: - As it is specified to answer 2, 3, and 4, we will answer only those. Given data is
Q: Your answer will be the production hours needed to execute your production plan - rounded to the…
A: Production is the process in which inputs are combined to have the required output. It includes a…
Q: Let us consider each of these differences. 1. Often, by its nature, service involves a much higher…
A: Customer interaction is the process by which companies tend to interact with the end customers to…
Q: Please provide formula and answer
A: Given data is Product Cookies Cupcakes Muffins Donuts Demand in dozens 600 500 400 300…
Practice example. Please shoow solution.
Trending now
This is a popular solution!
Step by step
Solved in 2 steps with 3 images
- The file P13_22.xlsx contains total monthly U.S. retail sales data. While holding out the final six months of observations for validation purposes, use the method of moving averages with a carefully chosen span to forecast U.S. retail sales in the next year. Comment on the performance of your model. What makes this time series more challenging to forecast?The Baker Company wants to develop a budget to predict how overhead costs vary with activity levels. Management is trying to decide whether direct labor hours (DLH) or units produced is the better measure of activity for the firm. Monthly data for the preceding 24 months appear in the file P13_40.xlsx. Use regression analysis to determine which measure, DLH or Units (or both), should be used for the budget. How would the regression equation be used to obtain the budget for the firms overhead costs?The file P13_02.xlsx contains five years of monthly data on sales (number of units sold) for a particular company. The company suspects that except for random noise, its sales are growing by a constant percentage each month and will continue to do so for at least the near future. a. Explain briefly whether the plot of the series visually supports the companys suspicion. b. By what percentage are sales increasing each month? c. What is the MAPE for the forecast model in part b? In words, what does it measure? Considering its magnitude, does the model seem to be doing a good job? d. In words, how does the model make forecasts for future months? Specifically, given the forecast value for the last month in the data set, what simple arithmetic could you use to obtain forecasts for the next few months?
- The file P13_42.xlsx contains monthly data on consumer revolving credit (in millions of dollars) through credit unions. a. Use these data to forecast consumer revolving credit through credit unions for the next 12 months. Do it in two ways. First, fit an exponential trend to the series. Second, use Holts method with optimized smoothing constants. b. Which of these two methods appears to provide the best forecasts? Answer by comparing their MAPE values.The file P13_29.xlsx contains monthly time series data for total U.S. retail sales of building materials (which includes retail sales of building materials, hardware and garden supply stores, and mobile home dealers). a. Is seasonality present in these data? If so, characterize the seasonality pattern. b. Use Winters method to forecast this series with smoothing constants = = 0.1 and = 0.3. Does the forecast series seem to track the seasonal pattern well? What are your forecasts for the next 12 months?The file P13_28.xlsx contains monthly retail sales of U.S. liquor stores. a. Is seasonality present in these data? If so, characterize the seasonality pattern. b. Use Winters method to forecast this series with smoothing constants = = 0.1 and = 0.3. Does the forecast series seem to track the seasonal pattern well? What are your forecasts for the next 12 months?
- The file P13_26.xlsx contains the monthly number of airline tickets sold by the CareFree Travel Agency. a. Create a time series chart of the data. Based on what you see, which of the exponential smoothing models do you think will provide the best forecasting model? Why? b. Use simple exponential smoothing to forecast these data, using a smoothing constant of 0.1. c. Repeat part b, but search for the smoothing constant that makes RMSE as small as possible. Does it make much of an improvement over the model in part b?Suppose that a regional express delivery service company wants to estimate the cost of shipping a package (Y) as a function of cargo type, where cargo type includes the following possibilities: fragile, semifragile, and durable. Costs for 15 randomly chosen packages of approximately the same weight and same distance shipped, but of different cargo types, are provided in the file P13_16.xlsx. a. Estimate a regression equation using the given sample data, and interpret the estimated regression coefficients. b. According to the estimated regression equation, which cargo type is the most costly to ship? Which cargo type is the least costly to ship? c. How well does the estimated equation fit the given sample data? How might the fit be improved? d. Given the estimated regression equation, predict the cost of shipping a package with semifragile cargo.The owner of a restaurant in Bloomington, Indiana, has recorded sales data for the past 19 years. He has also recorded data on potentially relevant variables. The data are listed in the file P13_17.xlsx. a. Estimate a simple regression equation involving annual sales (the dependent variable) and the size of the population residing within 10 miles of the restaurant (the explanatory variable). Interpret R-square for this regression. b. Add another explanatory variableannual advertising expendituresto the regression equation in part a. Estimate and interpret this expanded equation. How does the R-square value for this multiple regression equation compare to that of the simple regression equation estimated in part a? Explain any difference between the two R-square values. How can you use the adjusted R-squares for a comparison of the two equations? c. Add one more explanatory variable to the multiple regression equation estimated in part b. In particular, estimate and interpret the coefficients of a multiple regression equation that includes the previous years advertising expenditure. How does the inclusion of this third explanatory variable affect the R-square, compared to the corresponding values for the equation of part b? Explain any changes in this value. What does the adjusted R-square for the new equation tell you?
- Play Things is developing a new Lady Gaga doll. The company has made the following assumptions: The doll will sell for a random number of years from 1 to 10. Each of these 10 possibilities is equally likely. At the beginning of year 1, the potential market for the doll is two million. The potential market grows by an average of 4% per year. The company is 95% sure that the growth in the potential market during any year will be between 2.5% and 5.5%. It uses a normal distribution to model this. The company believes its share of the potential market during year 1 will be at worst 30%, most likely 50%, and at best 60%. It uses a triangular distribution to model this. The variable cost of producing a doll during year 1 has a triangular distribution with parameters 15, 17, and 20. The current selling price is 45. Each year, the variable cost of producing the doll will increase by an amount that is triangularly distributed with parameters 2.5%, 3%, and 3.5%. You can assume that once this change is generated, it will be the same for each year. You can also assume that the company will change its selling price by the same percentage each year. The fixed cost of developing the doll (which is incurred right away, at time 0) has a triangular distribution with parameters 5 million, 7.5 million, and 12 million. Right now there is one competitor in the market. During each year that begins with four or fewer competitors, there is a 25% chance that a new competitor will enter the market. Year t sales (for t 1) are determined as follows. Suppose that at the end of year t 1, n competitors are present (including Play Things). Then during year t, a fraction 0.9 0.1n of the company's loyal customers (last year's purchasers) will buy a doll from Play Things this year, and a fraction 0.2 0.04n of customers currently in the market ho did not purchase a doll last year will purchase a doll from Play Things this year. Adding these two provides the mean sales for this year. Then the actual sales this year is normally distributed with this mean and standard deviation equal to 7.5% of the mean. a. Use @RISK to estimate the expected NPV of this project. b. Use the percentiles in @ RISKs output to find an interval such that you are 95% certain that the companys actual NPV will be within this interval.The file P13_19.xlsx contains the weekly sales of a particular brand of paper towels at a supermarket for a one-year period. a. Using a span of 3, forecast the sales of this product for the next 10 weeks with the moving averages method. How well does this method with span 3 forecast the known observations in this series? b. Repeat part a with a span of 10. c. Which of these two spans appears to be more appropriate? Justify your choice.Dilberts Department Store is trying to determine how many Hanson T-shirts to order. Currently the shirts are sold for 21, but at later dates the shirts will be offered at a 10% discount, then a 20% discount, then a 40% discount, then a 50% discount, and finally a 60% discount. Demand at the full price of 21 is believed to be normally distributed with mean 1800 and standard deviation 360. Demand at various discounts is assumed to be a multiple of full-price demand. These multiples, for discounts of 10%, 20%, 40%, 50%, and 60% are, respectively, 0.4, 0.7, 1.1, 2, and 50. For example, if full-price demand is 2500, then at a 10% discount customers would be willing to buy 1000 T-shirts. The unit cost of purchasing T-shirts depends on the number of T-shirts ordered, as shown in the file P10_36.xlsx. Use simulation to determine how many T-shirts the company should order. Model the problem so that the company first orders some quantity of T-shirts, then discounts deeper and deeper, as necessary, to sell all of the shirts.