10. Which of the following is the most appropriate graph to compare th average number of mayas among rural and urban parks?
10. Which of the following is the most appropriate graph to compare th average number of mayas among rural and urban parks?

Glencoe Algebra 1, Student Edition, 9780079039897, 0079039898, 2018
18th Edition
ISBN:9780079039897
Author:Carter
Publisher:Carter
Chapter10: Statistics
Section10.4: Distributions Of Data
Problem 19PFA

Related questions
Question
100%
10. this is not a graded question.
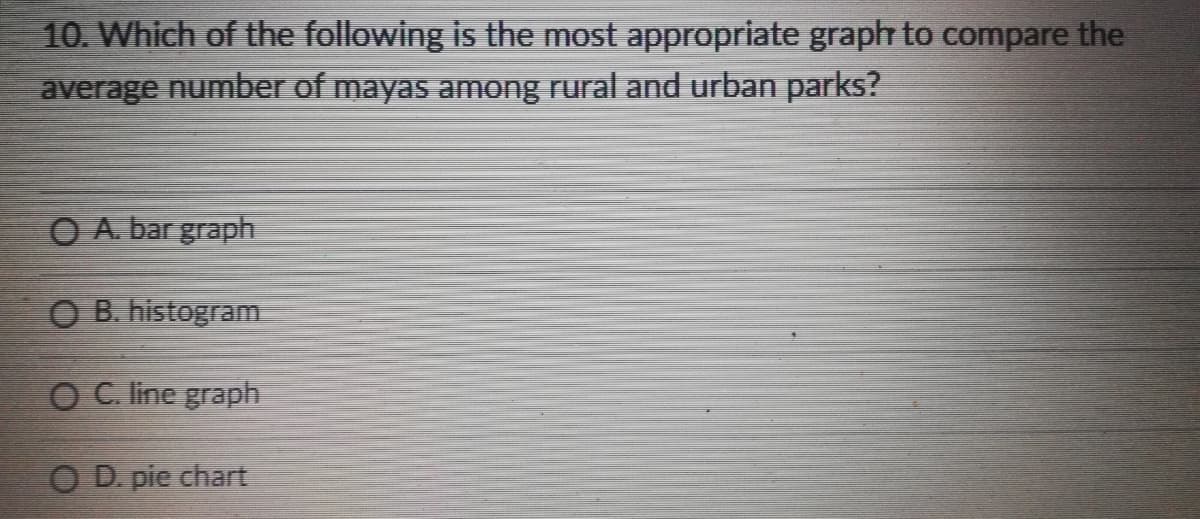
Transcribed Image Text:10. Which of the following is the most appropriate graph to compare the
average number of mayas among rural and urban parks?
O A. bar graph
O B. histogram
OC line graph
O D. pie chart
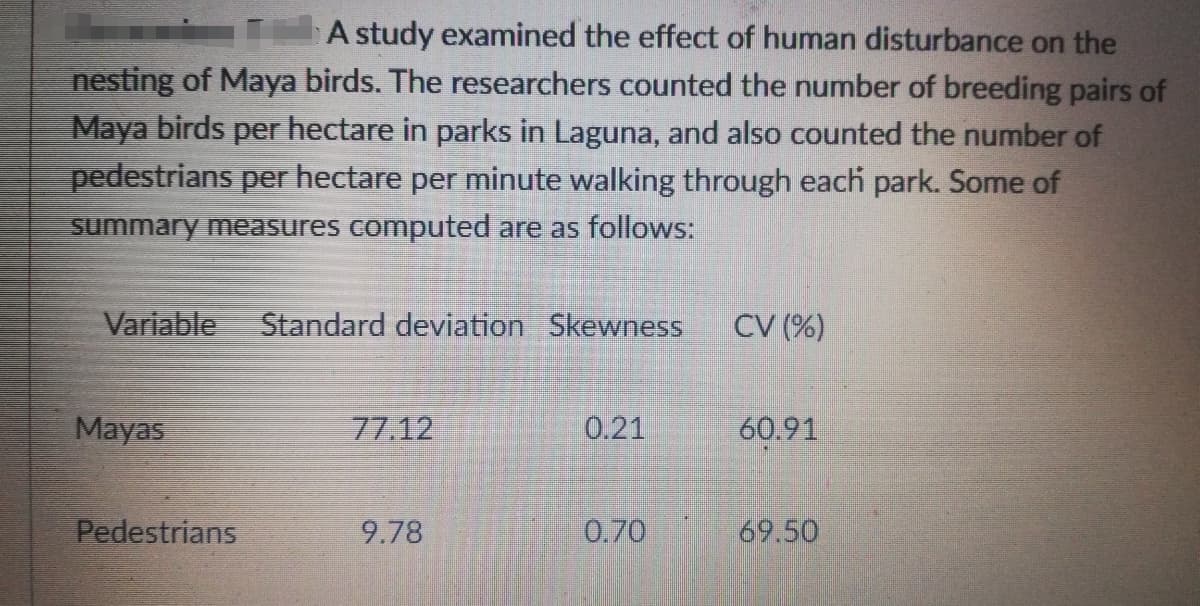
Transcribed Image Text:A study examined the effect of human disturbance on the
nesting of Maya birds. The researchers counted the number of breeding pairs of
Maya birds per hectare in parks in Laguna, and also counted the number of
pedestrians per hectare per minute walking through each park. Some of
summary measures computed are as follows:
Variable
Standard deviation Skewness
CV (%)
Mayas
77.12
0.21
60.91
Pedestrians
9.78
0.70
69.50
Expert Solution
This question has been solved!
Explore an expertly crafted, step-by-step solution for a thorough understanding of key concepts.

Step by step
Solved in 2 steps

Recommended textbooks for you
Glencoe Algebra 1, Student Edition, 9780079039897…
Algebra
ISBN:
9780079039897
Author:
Carter
Publisher:
McGraw Hill
Glencoe Algebra 1, Student Edition, 9780079039897…
Algebra
ISBN:
9780079039897
Author:
Carter
Publisher:
McGraw Hill