Give a brief interpretation from the table in the picture. Provide or answer also the ‘Descriptive Equivalent’ of the table. Make sure the interpretation is related to the given question in the table. Please refer to the subsequent picture for your guide. Note: Make sure your interpretation is the same or similar format with the guide
Give a brief interpretation from the table in the picture. Provide or answer also the ‘Descriptive Equivalent’ of the table. Make sure the interpretation is related to the given question in the table. Please refer to the subsequent picture for your guide. Note: Make sure your interpretation is the same or similar format with the guide

Glencoe Algebra 1, Student Edition, 9780079039897, 0079039898, 2018
18th Edition
ISBN:9780079039897
Author:Carter
Publisher:Carter
Chapter10: Statistics
Section10.6: Summarizing Categorical Data
Problem 4DGP

Related questions
Question
(8p)
General Instruction:
Give a brief interpretation from the table in the picture.
Provide or answer also the ‘Descriptive Equivalent’ of the table.
Make sure the interpretation is related to the given question in the table. Please refer to the subsequent picture for your guide.
Note: Make sure your interpretation is the same or similar format with the guide provided that is shown in the subsequent picture
.
Title for the tables: Youth Awareness and Perception Towards COVID-19.
Legend:
SD – Strongly Disagree
D – Disagree
A – Agree
SA – Strongly Agree
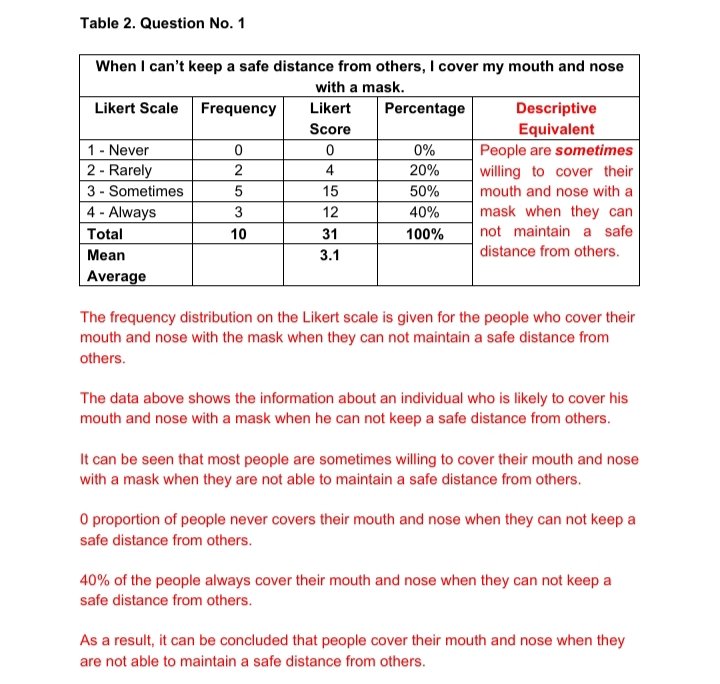
Transcribed Image Text:Table 2. Question No. 1
When I can't keep a safe distance from others, I cover my mouth and nose
with a mask.
Likert Scale Frequency
Likert
Percentage
Descriptive
Score
1- Never
2 - Rarely
Equivalent
People are sometimes
willing to cover their
0%
4
20%
3 - Sometimes
15
50%
mouth and nose with a
4 - Always
3
12
40%
mask when they can
Total
10
31
100%
not maintain a safe
Mean
3.1
distance from others.
Average
The frequency distribution on the Likert scale is given for the people who cover their
mouth and nose with the mask when they can not maintain a safe distance from
others.
The data above shows the information about an individual who is likely to cover his
mouth and nose with a mask when he can not keep a safe distance from others.
It can be seen that most people are sometimes willing to cover their mouth and nose
with a mask when they are not able to maintain a safe distance from others.
O proportion of people never covers their mouth and nose when they can not keep a
safe distance from others.
40% of the people always cover their mouth and nose when they can not keep a
safe distance from others.
As a result, it can be concluded that people cover their mouth and nose when they
are not able to maintain a safe distance from others.
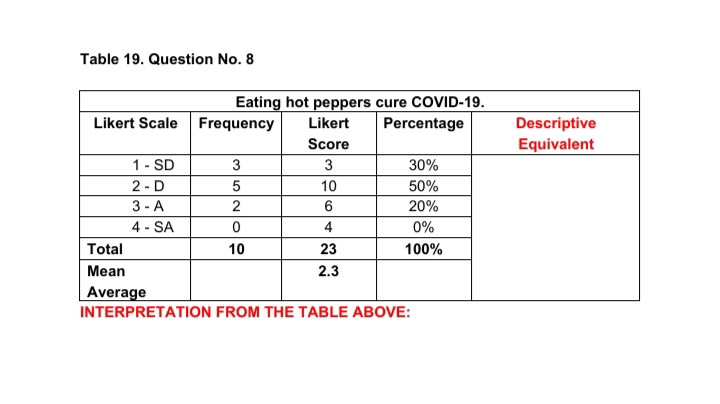
Transcribed Image Text:Table 19. Question No. 8
Eating hot peppers cure COVID-19.
Percentage
Likert Scale Frequency
Likert
Descriptive
Score
Equivalent
1- SD
3
3
30%
2 - D
5
10
50%
3 - A
4 - SA
6
20%
4
0%
Total
10
23
100%
Mean
2.3
Average
INTERPRETATION FROM THE TABLE ABOVE:
Expert Solution
This question has been solved!
Explore an expertly crafted, step-by-step solution for a thorough understanding of key concepts.

Step by step
Solved in 2 steps

Recommended textbooks for you
Glencoe Algebra 1, Student Edition, 9780079039897…
Algebra
ISBN:
9780079039897
Author:
Carter
Publisher:
McGraw Hill
Glencoe Algebra 1, Student Edition, 9780079039897…
Algebra
ISBN:
9780079039897
Author:
Carter
Publisher:
McGraw Hill