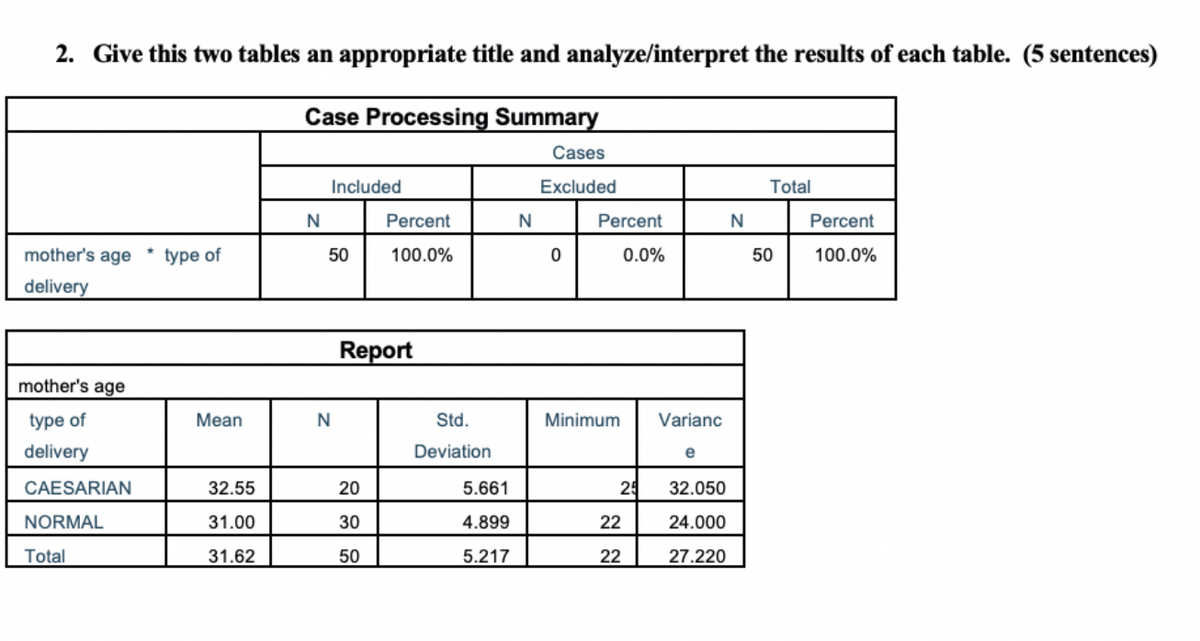
Give this two tables an appropriate title and analyze/interpret the results of each table. (5 sentences)


Q: What is a two-way table? Can you give me an example?
A: A two- way table shows how many data points lie within each category. A two-way table is a…
Q: At a certain middle school,
A: Given, at a certain middle school, half of the students are below average in English. Therefore, the…
Q: Name the four components of a mathematical system.
A: There are four components of a mathematical system.
Q: Which situation has a greater number of possibilities, one in which order matters or one in which…
A: When the order in which the elements are arranged matters, then Permutation is used. When the…
Q: Name the four components of a mathematical system
A: We need to name the four components of a mathematical system.
Q: Based on a total of 15,000 interactions across all typest, how much would Get Food Now earn from app…
A: Based on a total of 15,000 interactions across all typest,
Q: What is an Explicit Solution?
A: Here we need to define Explicit solution.
Q: I want a FULL answer with explanation for parts iii and IV
A: Given: Average rate of 3 customers per hour.
Q: How many paths spell PYTHAGORAS if you start from the top and proceed to the next row by moving…
A: There are multiple number of letters ar each level, hence, we can reach from one row to another row…
Q: If it was predicted that the farmland acreage lost to family dwellings over the next nine years…
A: It was predicted that farmland acreage lost by family during dwelling over nine months is 15000…
Q: Part 2 out of 3 Fewer than 5 couples will have a destination wedding P (fewer than 5 couples will…
A:
Q: Calculate the given linear combination.5〈2, 2, -3〉 + 3 〈1, 7, 2〉
A: A vector is a quantity that has both magnitude and direction. Linear combination of two vectors is…
Q: Give the 5 correct conclusions from the diagram
A: Given:
Q: If a data set contains three groups that each have ten people in them, how many rows will the “data…
A: Data View: A data view is the visual representation of data that differs from physical data. It is…
Q: Suppose A = (-1, –5, –7) and AB= (-5, 14, 4). Then В — (5,-70,-28) help (points)
A:
Q: Are the sources primary, secondary, or combination?
A: Primary sources provide raw information and first-hand evidence. Examples include interview…
Q: Explain the role of Venn-Diagram in science, engineering, medical and management sciences.
A: Venn diagram : It uses overlapping circles to illustrate the logical relationships between two or…
Q: A checker is placed in the bottom row of a checker board as shown below. It can move diagonally…
A: This is a counting problem.. we will solve it using the approach of dynamic programming
Q: if a 3x3 table is presented, then you know that a study used what independent variables each with…
A: n x m table would contain n – 1 independent variable and m categories.
Q: Both pictures are same question!
A: Given radius=8 and angle is 65° we need to find the area of the sector A The area of the sector of…
Q: create a diagram of the situation 81% of college students take online classes, 36% online students…
A:
Q: What is a two-way table?
A: given, two-way table.
Q: What two words, in the correct order, best complete the following sentence regarding the use of…
A: All models are wrong but some models are useful. So, the fourth option is the correct answer.
Q: Graph the image of kite JKLM 104 轟 -10 -2 2. 9. -21 6.
A: Given query is to graph the image after 270° counter clockwise rotation about origin.
Q: nagazine, 20% read Canadian B oth The Economist and Maclea
A: As per the bartleby guidelines for more than one question only one has to be solved. Please upload…
Q: Create a two-way table from the diagram:
A:
Q: What types of information could be illustrated in a visual display? In a tabular display?
A: We know that, Visual display : A graph is a visual display of information of data. It includes…
Q: Hypothesis: M
A: first of all we have to construct null and alternative hypotheses as follows :- we know that null…
Q: Please help me with my assignment question 18,19
A: The product of (4 +4i) and (3-2i) Consider, (4+4i) (3-2i) By using distributive property, (a+b)*c…
Q: What pattern can be seen in our surroundings?
A: There are many mathematical patterns in the surroundings.
Q: b) Will a dummy variable trap always exist if the number of dummies taken for a variable is same as…
A: 1.Linear regression is used to known the relationship between one or more predictor variable and a…
Q: Scott and Associates, Inc., is an accounting firm that has three new clients. Project leaders ill be…
A: Given: Scott and Associates, Inc., is an accounting firm that has three new clients. Project leaders…
Q: 9. Is it possible to take a walk around the city whose map is shown below, starting and ending at…
A: We have to find a path which is starts and ends at the same point.
Q: at are some possible topics for a research paper that uses a secondary source that is about the…
A: Secondary source for a research paper The research that is based on such data which is not collected…
Q: I need help with part b, c and d
A:
Q: Can someone cross all the bridges shown in this map exactly once and return to the starting point?
A:
Q: Use the diagram to answer the following:
A:
Q: Based on the total of 15,000 interaction (Across all types), how much would Get Food Now earn from…
A: 33% of 15000 interactions are for app interactions So (15000*33)/100 = 4950 interactions
Q: Determine the number of paths from A to B if you can only move East and South. A B
A:
Q: Ms. Cameron was making a table of a linear pattern, but she got interrupted by a fire drill.…
A: Given that, Ms. Cameron was making a table of a linear pattern, but she got interrupted by a fire…
Q: Name the four parts of a mathematical system.
A: mathematical system consists of four parts.
Q: For the three-part question that follows, provide your answer to each part in the given workspace.…
A: Given that:
Q: Match each bit of given info with a conclusion
A:
Q: two possible routes,
A:
Q: What is the VALUE of A2B2C216 in Octal System?
A:
Q: Two teams are playing in the finals for an adult softball league. Each team has 13 players and the…
A:
Q: The bus has left seats and right seats with the maximum seating capacity of 48 persons. what is the…
A:
pls answer..

Step by step
Solved in 2 steps

- Two groups of secretaries operate under the same manager. Both groups have the same number of people, use the same equipment, and turn out about the same amount of work. During one maintenance penod group A had 10 service calls on the equipment, while group B had only 6 calls From these data, would you conclude that group A was harder on the equipment?Control limits for an xbar−Chart have been determined as: UCL xbar = 56.4 and LCL xbar = 53.2 1. Sample averages for the most recent five samples, in sequential order, are 53.7, 53.8, 54.7, 55.4, and 56.3. What should be concluded about the process average? Should some action be taken? Why or why not? 2. What would you conclude about the process average if the sample means, in sequential order, were 55.4, 54.9, 56.1, 55.6, and 55.2? This question is about constructing the X -bar Chart using the Upper Control Limit and the Lower Control Limit that has been given. Thank you.As you read about each study, (a) classify the type of research that it reflects, and (b) identify the kinds of conclusions that might reasonably be drawn from the results. The director of computer technology in Emerson School District wants to gather information about the use of technology-based instruction in language arts and literature classes in the district's middle schools and high schools. For her study, the director identifies five of the top teachers in these content areas. She visits and observes each teacher's classes on three different days and subsequently interviews each teacher. Then she summarizes the ways that these teachers incorporate the use of technology into their lessons and their students' activities. The director also summarizes teachers' beliefs about the roles of technology in students' learning and motivation. (a) Classify the research as one of the following: Quantitative/descriptive Quantitative/correlational…
- Of the 30 newly accepted juveniles into juvenile hall, half were placed in the regular program and half were placed in the vitamin and supplements program. After 12 months researchers documented the number of infractions that occurred for each of the 30 students and wanted to assess if the program worked. Group 1 (average infractions per month)• 3.2 1 0 4.7 5.3 2 1.6 4 2.8 7 4 3.1 5.7 0 1.8 Group 2 -Vitamins (average infractions per month) 0 5.2 1.2 2.1 3 1.7 0 2.9 .7 4.3 3.1 1.4 2 .9 2.6 Construct an independent samples t-test either by hand or using spss. (Be sure to interpret)Of the 30 newly accepted juveniles into juvenile hall, half were placed in the regular program and half were placed in the vitamin and supplements program. After 12 months researchers documented the number of infractions that occurred for each of the 30 students and wanted to assess if the program worked. Group 1 (average infractions per month)• 3.2 1 0 4.7 5.3 2 1.6 4 2.8 7 4 3.1 5.7 0 1.8 Group 2 -Vitamins (average infractions per month) 0 5.2 1.2 2.1 3 1.7 0 2.9 .7 4.3 3.1 1.4 2 .9 2.6 Construct an independent samples t-test by hand. (Be sure to interpret)A research company has designed three different systems to clean up oil spillages. The following table contains the results, measured by how much surface area (in square meters) is cleared in 1 hour. The data were found by testing each method in several trials. Is there any significant difference in the testing of effectiveness of the three systems? Use the 0.05 level of significance. System A System B System C 274 276 285 279 272 271 282 283 280 275 268 276 278 281 - 274 - -
- All of the following are common strategies in qualitative data analysis except: a. use of tests of significance b. use of hierarchies c. use of typologies d. use of networks2.2 A manager informs 2 employees, Annie and Caroline, that their performance will be rated according to categories with the percentage weightings shown in the Table below. The one who obtains the largest weighted mean score will be awarded a salary rise. Category Weighting Initiative 30% Creativity 50% Ability to meet deadlines 20% Annie and Caroline are given score out of 10 in each category, and their scores are shown below Category Annie’s scores Caroline’s scores Initiative 3.5 6.0 Creativity 8.0 6.5 Ability to meet deadlines 5.5 8.0 2.2.1 Calculate the unweight mean score for each employee, state who get salary rise sing this method. (4) 2.2.2 Calculate the weighted mean score for each employee, and state who get salary rise using this methodA researcher wants to understand how an annual mortgage payment (in Ringgit) depends on income level and zonal location allowing for interaction. The data are shown below: SUMMARY LOW MEDIUM HIGH Total KOTA KINABALU Count 5 5 5 15 Sum 799 959 1020 2778 Average 159.8 191.8 204 185.2 Variance 1151.2 40.7 607.5 886.314286 SANDAKAN Count 5 5 5 15 Sum 1197 1333 1971 4501 Average 239.4 266.6 394.2 300.066667 Variance 5108.8 1918.8 8242.2 9241.92381 TAWAU Count 5 5 5 15 Sum 742 915 1068 2725 Average 148.4 183 213.6 181.666667 Variance 3394.8 10957.5 532.8 5012.95238 LAHAD DATU Count 5 5 5 15 Sum 670 651 806 2127 Average 134 130.2 161.2 141.8 Variance 1480 1181.7 1993.7 1534.31429 KENINGAU Count 5 5 5 15 Sum 98 205 237 540…
- Periodically, Merrill Lynch customers are asked to evaluate Merrill Lynch financial consultants and services (2000 Merrill Lynch Client Satisfaction Survey). Higher ratings on the client satisfaction survey indicate better service with 7 the maximum service rating. Independent samples of service ratings for two financial consultants are summarized here. Consultant A has 10 years of experience, whereas consultant B has 1 year of experience. Use = .05 and test to see whether the consultant with more experience has the higher population mean service rating. Consultant A Consultant B = 16 = 10 = 6.82 = 6.25 = 0.58 = 0.7 State the null and alternative hypotheses.H0: 1 - 2 Selectgreater than 0greater than or equal to 0less than 0less than or equal to 0equal to 0not equal to 0Item 1Ha: 1 - 2 Selectgreater than 0greater than or equal to 0less than 0less than or equal to 0equal to 0not equal to 0Item 2 Compute the value of the test statistic (to 2 decimals).…The Accountability Office is auditing Star International Airways, which flies numerous charters. The Titan contract specifies that the average flight may be no more than 15 minutes late. A sample of 20 flights reveals the results below: Flights and Their Delay Status Flight Number Status 217 On time 167 20 minutes late 133 17 minutes late 207 64 minutes late 219 On time 457 96 minutes late 371 30 minutes late 612 On time 319 6 minutes late 423 12 minutes late 684 11 minutes late 661 61 minutes late 511 On time 536 On time 493 17 minutes late 382 12 minutes late 115 6 minutes late 107 3 minutes late 19 26 minutes late 123 19 minutes late The newly hired junior analyst, Bob, is requested to write a memo interpreting this information. Bob finds that he needs a good grasp of statistical inference to write the memo. He researches statistical inference and…Suppose Ted is creating a football team in a video game that features many NFL players. He decides to identify players who are outliers in a few statistics he has chosen. Currently, he's looking at wide receivers. The game includes the top 100 receivers in 2012 by number of receptions. Ted, however, is more interested in receiving yards, and the table shows the five-number summary of the available players in the game (in yards): Minimum 1st quartile (Q1) Median 3rd quartile (Q3) Maximum 258.0 549.5 743.0 936.5 1964.0 The mean is 787.6 yds with a standard deviation of 311.3 yds. Ted first calculates the interquartile range (IQR). Next, to determine suspected outliers, he calculates Q1−1.5⋅???Q1−1.5⋅IQR and Q3+1.5⋅???Q3+1.5⋅IQR. Specify those results to at least one decimal place. Q1−1.5⋅???Q1−1.5⋅IQR = Q3+1.5⋅???Q3+1.5⋅IQR =