given: 110 homes in kingston (n1) and the proportion of the sample is p1 100 homes in owen sound (n2) and the proportion of the sample is p2 sample: 35 homes from kingston (n1) and 20 homes from owen sound (n2) find: a) the observed value b) p value c) confidence interval at 95% for the difference p1-p2
given: 110 homes in kingston (n1) and the proportion of the sample is p1 100 homes in owen sound (n2) and the proportion of the sample is p2 sample: 35 homes from kingston (n1) and 20 homes from owen sound (n2) find: a) the observed value b) p value c) confidence interval at 95% for the difference p1-p2

College Algebra (MindTap Course List)
12th Edition
ISBN:9781305652231
Author:R. David Gustafson, Jeff Hughes
Publisher:R. David Gustafson, Jeff Hughes
Chapter8: Sequences, Series, And Probability
Section8.7: Probability
Problem 58E: What is meant by the sample space of an experiment?

Related questions
Question
given:
110 homes in kingston (n1) and the proportion of the sample is p1
100 homes in owen sound (n2) and the proportion of the sample is p2
sample: 35 homes from kingston (n1) and 20 homes from owen sound (n2)
find:
a) the observed value
b) p value
c) confidence interval at 95% for the difference p1-p2
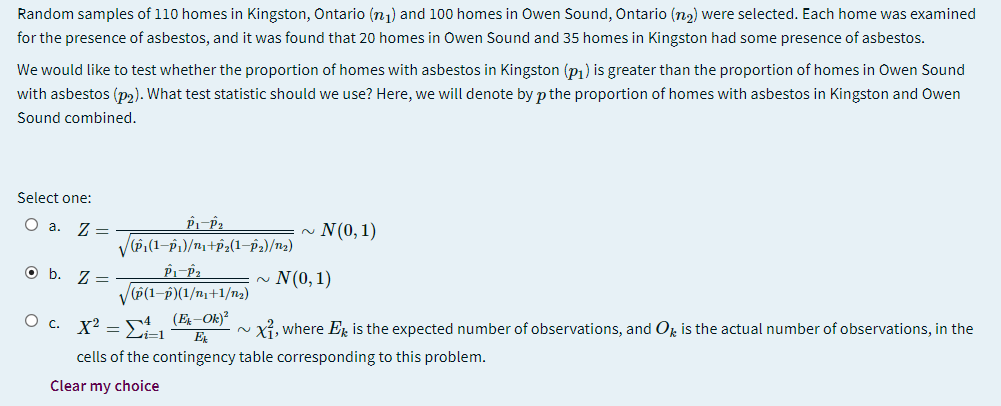
Transcribed Image Text:Random samples of 110 homes in Kingston, Ontario (n1) and 100 homes in Owen Sound, Ontario (na) were selected. Each home was examined
for the presence of asbestos, and it was found that 20 homes in Owen Sound and 35 homes in Kingston had some presence of asbestos.
We would like to test whether the proportion of homes with asbestos in Kingston (p1) is greater than the proportion of homes in Owen Sound
with asbestos (p2). What test statistic should we use? Here, we will denote by p the proportion of homes with asbestos in Kingston and Owen
Sound combined.
Select one:
O a. 7 =
N(0, 1)
2.
Ob.
Z =
V(P(1-p)(1/n1+1/n2)
N(0, 1)
O c. x2 – s4 (E-Ok)²
Li-1
Xỉ, where Er is the expected number of observations, and Op is the actual number of observations, in the
2.
E
cells of the contingency table corresponding to this problem.
Clear my choice

Transcribed Image Text:We would next like to construct a 95% confidence interval for the difference p - p2. What is the lower endpoint of this confidence interval? Give
answer to 3 decimal places.
Expert Solution
This question has been solved!
Explore an expertly crafted, step-by-step solution for a thorough understanding of key concepts.

Step by step
Solved in 2 steps with 2 images

Recommended textbooks for you
College Algebra (MindTap Course List)
Algebra
ISBN:
9781305652231
Author:
R. David Gustafson, Jeff Hughes
Publisher:
Cengage Learning
College Algebra (MindTap Course List)
Algebra
ISBN:
9781305652231
Author:
R. David Gustafson, Jeff Hughes
Publisher:
Cengage Learning