Given: A regression of the logarithm of average hourly earnings, ln(wage) on educ, exper, exper2, female, married and numdep. Question: What is the statistical significance of each of the slope coefficients and interpret the coefficient on female and married.
Big Ideas Math A Bridge To Success Algebra 1: Student Edition 2015
1st Edition
ISBN:9781680331141
Author:HOUGHTON MIFFLIN HARCOURT
Publisher:HOUGHTON MIFFLIN HARCOURT
Chapter11: Data Analysis And Displays
Section11.4: Two-ways Tables
Problem 12E
icon
Related questions
icon
Concept explainers
Question

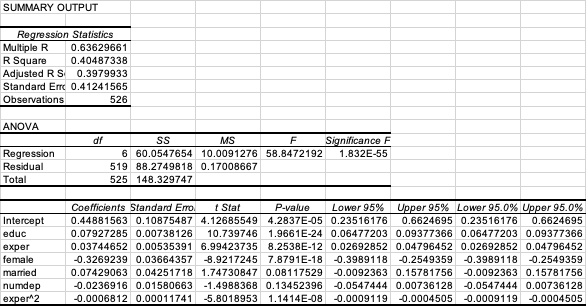
Given: A regression of the logarithm of average hourly earnings, ln(wage) on educ, exper, exper2, female, married and numdep.

Question: What is the statistical significance of each of the slope coefficients and interpret the coefficient on female and married.

SUMMARY OUTPUT
Regression Statistics
Multiple R
R Square
Adjusted R S 0.3979933
0.63629661
0.40487338
Standard Erre 0.41241565
Observations
526
ANOVA
df
Significance F
MS
F
Regression
6 60.0547654 10.0091276 58.8472192
1.832E-55
Residual
519 88.2749818 0.17008667
Total
525 148.329747
Coefficients Standard Ero.
t Stat
P-value
Lower 95%
Upper 95% Lower 95.0% Upper 95.0%
Intercept
educ
0.44881563 0.10875487 4.12685549 4.2837E-05 0.23516176
0.6624695 0.23516176
0.6624695
0.07927285 0.00738126
10.739746 1.9661E-24 0.06477203 0.09377366 0.06477203 0.09377366
0.03744652 0.00535391 6.99423735 8.2538E-12 0.02692852 0.04796452 0.02692852 0.04796452
exper
female
-0.3269239 0.03664357 -B.9217245 7.8791E-18 -0.3989118 -0.2549359 -0.3989118 -0.2549359
married
0.07429063 0.04251718 1.74730847 0.08117529 -0.0092363 0.15781756
-0.0092363 0.15781756
numdep
-0.0236916 0.01580663 -1.4988368 0.13452396 -0.0547444 0.00736128
-0.0547444 0.00736128
exper^2
-0.0006812 0.00011741 -5.8018953 1.1414E-08 -0.0009119 -0.0004505
-0.0009119
-0.0004505
Transcribed Image Text:SUMMARY OUTPUT Regression Statistics Multiple R R Square Adjusted R S 0.3979933 0.63629661 0.40487338 Standard Erre 0.41241565 Observations 526 ANOVA df Significance F MS F Regression 6 60.0547654 10.0091276 58.8472192 1.832E-55 Residual 519 88.2749818 0.17008667 Total 525 148.329747 Coefficients Standard Ero. t Stat P-value Lower 95% Upper 95% Lower 95.0% Upper 95.0% Intercept educ 0.44881563 0.10875487 4.12685549 4.2837E-05 0.23516176 0.6624695 0.23516176 0.6624695 0.07927285 0.00738126 10.739746 1.9661E-24 0.06477203 0.09377366 0.06477203 0.09377366 0.03744652 0.00535391 6.99423735 8.2538E-12 0.02692852 0.04796452 0.02692852 0.04796452 exper female -0.3269239 0.03664357 -B.9217245 7.8791E-18 -0.3989118 -0.2549359 -0.3989118 -0.2549359 married 0.07429063 0.04251718 1.74730847 0.08117529 -0.0092363 0.15781756 -0.0092363 0.15781756 numdep -0.0236916 0.01580663 -1.4988368 0.13452396 -0.0547444 0.00736128 -0.0547444 0.00736128 exper^2 -0.0006812 0.00011741 -5.8018953 1.1414E-08 -0.0009119 -0.0004505 -0.0009119 -0.0004505
Expert Solution
trending now

Trending now

This is a popular solution!

steps

Step by step

Solved in 2 steps with 1 images

Blurred answer
Knowledge Booster
Correlation, Regression, and Association
Learn more about
Need a deep-dive on the concept behind this application? Look no further. Learn more about this topic, statistics and related others by exploring similar questions and additional content below.
Similar questions
Recommended textbooks for you
Big Ideas Math A Bridge To Success Algebra 1: Stu…
Algebra
ISBN:
9781680331141
Author:
HOUGHTON MIFFLIN HARCOURT
Publisher:
Houghton Mifflin Harcourt
Algebra & Trigonometry with Analytic Geometry
Algebra
ISBN:
9781133382119
Author:
Swokowski
Publisher:
Cengage
Linear Algebra: A Modern Introduction
Algebra
ISBN:
9781285463247
Author:
David Poole
Publisher:
Cengage Learning
Functions and Change: A Modeling Approach to Coll…
Algebra
ISBN:
9781337111348
Author:
Bruce Crauder, Benny Evans, Alan Noell
Publisher:
Cengage Learning