Given is the population of residents in a community grouped according to their blood type. Complete the table applying both equal and proportional allocation. Blood Type Population Size Equal Allocation Proportional Allocation A 127 163 58 AB 52 Total 400 From the total of 400, your target sample size is n = 100. Round off your answer to the nearest whole number. %3D
Given is the population of residents in a community grouped according to their blood type. Complete the table applying both equal and proportional allocation. Blood Type Population Size Equal Allocation Proportional Allocation A 127 163 58 AB 52 Total 400 From the total of 400, your target sample size is n = 100. Round off your answer to the nearest whole number. %3D

MATLAB: An Introduction with Applications
6th Edition
ISBN:9781119256830
Author:Amos Gilat
Publisher:Amos Gilat
Chapter1: Starting With Matlab
Section: Chapter Questions
Problem 1P

Related questions
Question
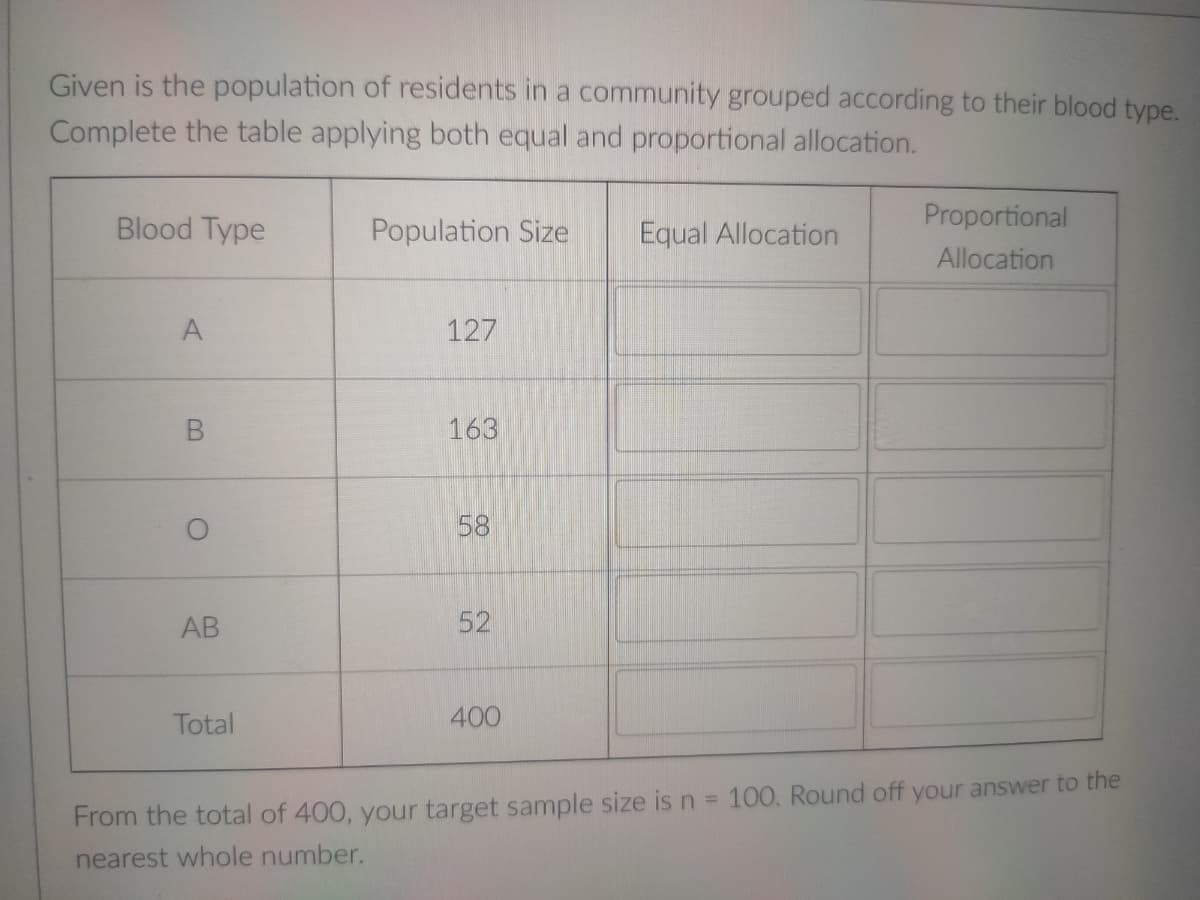
Transcribed Image Text:Given is the population of residents in a community grouped according to their blood type.
Complete the table applying both equal and proportional allocation.
Proportional
Blood Type
Population Size
Equal Allocation
Allocation
A
127
163
58
AB
52
Total
400
From the total of 400, your target sample size is n = 100, Round off your answer to the
nearest whole number.
Expert Solution
This question has been solved!
Explore an expertly crafted, step-by-step solution for a thorough understanding of key concepts.

Step by step
Solved in 2 steps with 2 images

Recommended textbooks for you
MATLAB: An Introduction with Applications
Statistics
ISBN:
9781119256830
Author:
Amos Gilat
Publisher:
John Wiley & Sons Inc

Probability and Statistics for Engineering and th…
Statistics
ISBN:
9781305251809
Author:
Jay L. Devore
Publisher:
Cengage Learning

Statistics for The Behavioral Sciences (MindTap C…
Statistics
ISBN:
9781305504912
Author:
Frederick J Gravetter, Larry B. Wallnau
Publisher:
Cengage Learning
MATLAB: An Introduction with Applications
Statistics
ISBN:
9781119256830
Author:
Amos Gilat
Publisher:
John Wiley & Sons Inc
Probability and Statistics for Engineering and th…
Statistics
ISBN:
9781305251809
Author:
Jay L. Devore
Publisher:
Cengage Learning
Statistics for The Behavioral Sciences (MindTap C…
Statistics
ISBN:
9781305504912
Author:
Frederick J Gravetter, Larry B. Wallnau
Publisher:
Cengage Learning

Elementary Statistics: Picturing the World (7th E…
Statistics
ISBN:
9780134683416
Author:
Ron Larson, Betsy Farber
Publisher:
PEARSON

The Basic Practice of Statistics
Statistics
ISBN:
9781319042578
Author:
David S. Moore, William I. Notz, Michael A. Fligner
Publisher:
W. H. Freeman

Introduction to the Practice of Statistics
Statistics
ISBN:
9781319013387
Author:
David S. Moore, George P. McCabe, Bruce A. Craig
Publisher:
W. H. Freeman