Given the 5 categories in the table below, test the claim that the categories are equally likely to be selected at a a = 0.05 significance level. Category Observed Expected Frequency Frequency A 23 7 C 10 E 19 a. Complete the table by calculating the expected frequencies. b. What is the chi-square test statistic? Round to three decimal places. c. What are the degrees of freedom? d.f.= B.
Given the 5 categories in the table below, test the claim that the categories are equally likely to be selected at a a = 0.05 significance level. Category Observed Expected Frequency Frequency A 23 7 C 10 E 19 a. Complete the table by calculating the expected frequencies. b. What is the chi-square test statistic? Round to three decimal places. c. What are the degrees of freedom? d.f.= B.

College Algebra (MindTap Course List)
12th Edition
ISBN:9781305652231
Author:R. David Gustafson, Jeff Hughes
Publisher:R. David Gustafson, Jeff Hughes
Chapter8: Sequences, Series, And Probability
Section8.CT: Chapter Test
Problem 24CT: Show the sample space of the experiment: toss a fair coin three times.

Related questions

Question
Transcribed Image Text:People
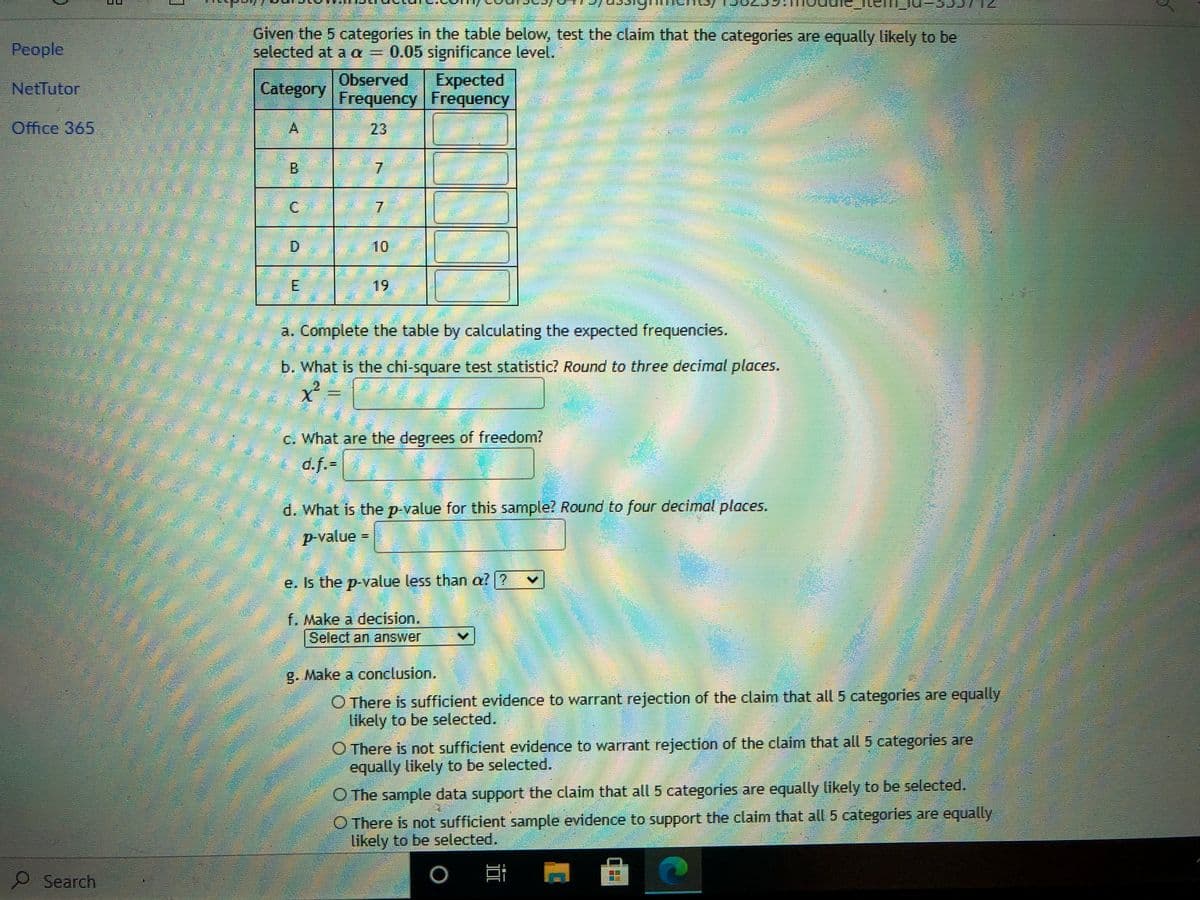
Given the 5 categories in the table below, test the claim that the categories are equally likely to be
selected at a a = 0.05 significance level.
NetTutor
Category
Observed
Expected
Frequency Frequency
Office 365
23
B.
7.
C.
D.
10
19
a. Complete the table by calculating the expected frequencies.
b. What is the chi-square test statistic? Round to three decimal places.
2.
x² =
c. What are the degrees of freedom?
d.f.=
d. What is the p-value for this sample? Round to four decimal places.
p-value =
e. Is the p-value less than a? ?
f. Make a decision.
Select an answer
g. Make a conclusion.
O There is sufficient evidence to warrant rejection of the claim that all 5 categories are equally
likely to be selected.
O There is not sufficient evidence to warrant rejection of the claim that all 5 categories are
equally likely to be selected.
O The sample data support the claim that all 5 categories are equally likely to be selected.
O There is not sufficient sample evidence to support the claim that all 5 categories are equally
likely to be selected.
P Search
Expert Solution
This question has been solved!
Explore an expertly crafted, step-by-step solution for a thorough understanding of key concepts.

This is a popular solution!

Trending now
This is a popular solution!

Step by step
Solved in 3 steps with 1 images

Knowledge Booster


Learn more about
Need a deep-dive on the concept behind this application? Look no further. Learn more about this topic, statistics and related others by exploring similar questions and additional content below.Recommended textbooks for you
College Algebra (MindTap Course List)
Algebra
ISBN:
9781305652231
Author:
R. David Gustafson, Jeff Hughes
Publisher:
Cengage Learning
College Algebra (MindTap Course List)
Algebra
ISBN:
9781305652231
Author:
R. David Gustafson, Jeff Hughes
Publisher:
Cengage Learning