Given the 5 categories in the table below, test the claim that the categories are equally likely to be selected at a α = 0.05 significance level. Observed Category Frequency 13 A B C D E 17 22 11 5 Expected Frequency a. Complete the table by calculating the expected frequencies. b. What is the chi-square test statistic? Round to three decimal places. x² = c. What are the degrees of freedom? d.f.- d. What is the p-value for this sample? Round to four decimal places. p-value= e. Is the p-value less than a?? f. Make a decision. Select an answer g. Make a conclusion. O There is sufficient evidence to warrant rejection of the claim that all 5 categories are equally likely to be selected. There is not sufficient evidence to warrant rejection of the claim that all 5 categories are equally likely to be selected. The sample data support the claim that all 5 categories are equally likely to be selected. There is not sufficient sample evidence to support the claim that all 5 categories are equally likely to be selected
Given the 5 categories in the table below, test the claim that the categories are equally likely to be selected at a α = 0.05 significance level. Observed Category Frequency 13 A B C D E 17 22 11 5 Expected Frequency a. Complete the table by calculating the expected frequencies. b. What is the chi-square test statistic? Round to three decimal places. x² = c. What are the degrees of freedom? d.f.- d. What is the p-value for this sample? Round to four decimal places. p-value= e. Is the p-value less than a?? f. Make a decision. Select an answer g. Make a conclusion. O There is sufficient evidence to warrant rejection of the claim that all 5 categories are equally likely to be selected. There is not sufficient evidence to warrant rejection of the claim that all 5 categories are equally likely to be selected. The sample data support the claim that all 5 categories are equally likely to be selected. There is not sufficient sample evidence to support the claim that all 5 categories are equally likely to be selected

College Algebra (MindTap Course List)
12th Edition
ISBN:9781305652231
Author:R. David Gustafson, Jeff Hughes
Publisher:R. David Gustafson, Jeff Hughes
Chapter8: Sequences, Series, And Probability
Section8.7: Probability
Problem 5E: List the sample space of each experiment. Rolling one die and tossing one coin

Related questions
Question
100%
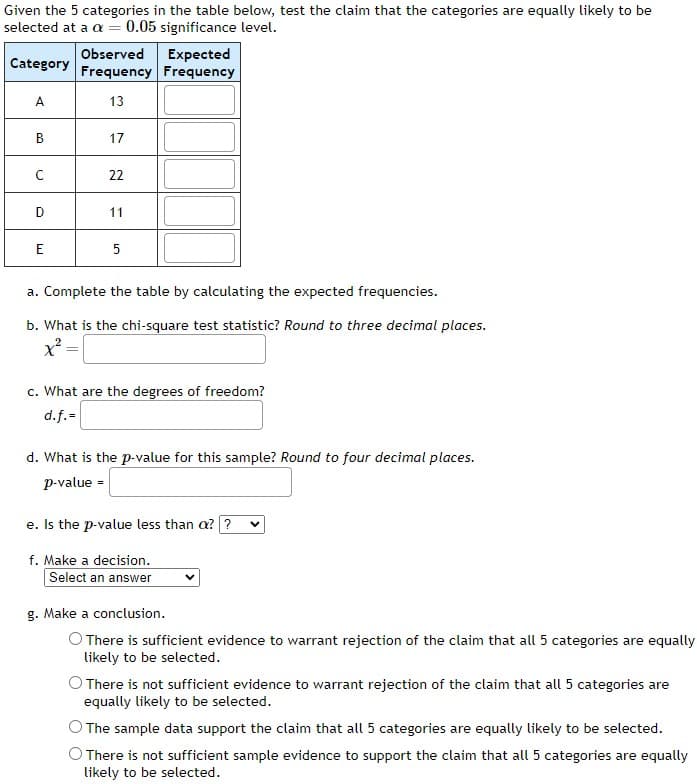
Transcribed Image Text:Given the 5 categories in the table below, test the claim that the categories are equally likely to be
selected at a a = 0.05 significance level.
Category
A
B
с
D
E
Observed
Frequency
13
17
22
11
5
Expected
Frequency
a. Complete the table by calculating the expected frequencies.
b. What is the chi-square test statistic? Round to three decimal places.
x²=
c. What are the degrees of freedom?
d.f.=
d. What is the p-value for this sample? Round to four decimal places.
p-value =
e. Is the p-value less than a??
f. Make a decision.
Select an answer
g. Make a conclusion.
O There is sufficient evidence to warrant rejection of the claim that all 5 categories are equally
likely to be selected.
There is not sufficient evidence to warrant rejection of the claim that all 5 categories are
equally likely to be selected.
The sample data support the claim that all 5 categories are equally likely to be selected.
There is not sufficient sample evidence to support the claim that all 5 categories are equally
likely to be selected.
Expert Solution
Step 1
In categorical data, there are k classes with observed frequency O and expected frequency E. The test statistic U has an approximate chi-square distribution with k-1 degrees of freedom. The test statistic is given by the following formula

Trending now
This is a popular solution!

Step by step
Solved in 2 steps with 1 images

Recommended textbooks for you
College Algebra (MindTap Course List)
Algebra
ISBN:
9781305652231
Author:
R. David Gustafson, Jeff Hughes
Publisher:
Cengage Learning
College Algebra (MindTap Course List)
Algebra
ISBN:
9781305652231
Author:
R. David Gustafson, Jeff Hughes
Publisher:
Cengage Learning