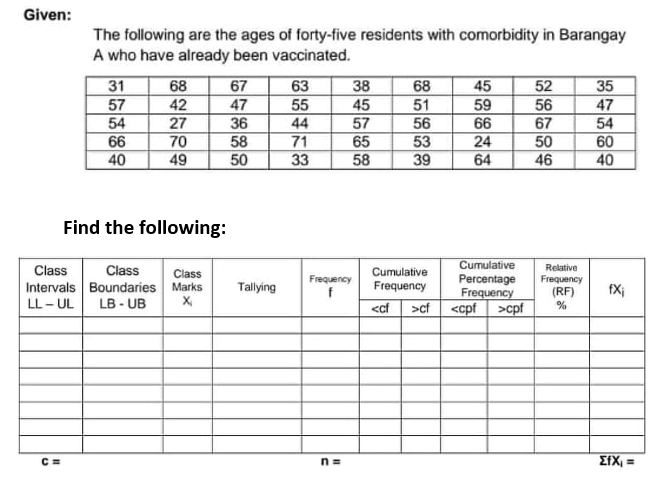
Given: The following are the ages of forty-five residents with comorbidity in Barangay A who have already been vaccinated. 31 57 54 35 47 54 60 40 67 68 42 27 38 45 57 65 58 68 51 56 53 52 56 67 50 46 63 55 45 47 59 66 36 44 66 40 71 33 70 58 24 49 50 39 64 Find the following: Cumulative Class Intervals Boundaries Marks LL - UL Relative Frequency (RF) Class Class Cumulative Percentage Frequency cf >cpf EfX, =
Q: Make 1 real-life problem with a solution in any of the following topics; 4. Preforming hypothesis…
A: If a random pattern length of eighty college students from School 1 well-known shows 19 college…
Q: With these numbers, I calculated the average to be 3.9828. How do I calculate the uncertainty in the…
A: The provided information is The average of given data is…
Q: a) Determine the independent and dependent variable. b) Calculate the Pearson's product moment…
A: The question is based on a correlation Given :
Q: 3) An F-1 race has an average length of 305 kilometers with a standard deviation of 72 kilometers.…
A:
Q: QUESTION 24 Consider the following data x 81 75 71 61 96 56 85 18 y 80 82 83 57 100 30 68 56 (a)…
A: Given that
Q: The average life of a smartphone is 7 years with a standard deviation of 1 year. Assuming that the…
A:
Q: (a) Compute the sample proportion p. Round the answer to at least three decimal places. The sample…
A: Since you have posted a question with multiple sub-parts, we will solve first three subparts for…
Q: g. The p-value is Select an answer a h. Based on this, we should Select an answer i. Thus, the final…
A:
Q: You are interested in finding a 90% confidence interval for the average number of days of class that…
A:
Q: Please specify the key problem with this question included in a questionnaire: "Don't you think the…
A: Given a questionnaire question:-"Don't you think the presidential election process has become more…
Q: Male Female Child 64 59 Total Suppose the data to the right represent the survival data for the a…
A:
Q: 16. Which of the following would be affected the most if there is an extremely large value in the…
A:
Q: What was the mean commissioned earned?
A: here denote x = sales representative Earning
Q: A physician claims that jogger's maximal volume oxygen uptake is greater than the ar of all adults.…
A:
Q: 4. Upper 38% 5. Lower 55%
A:
Q: The All Ages Records shop finds that 80% of customers entering the store do not make a purchase. One…
A: The provided information is n=180 p=0.80 a. The mean of sample proportion of customers making a…
Q: Below are the jersey numbers of 11 players randomly selected from a football team. Find the range,…
A: Given data: 40, 91, 95, 39, 96, 78, 23, 98, 37, 85, 9
Q: 2. Let (X,Y) be a continuous bivariate random variable having the joint probability density function…
A:
Q: how large a sample size should they consider
A: here given , population standard deviation = σ = 60000 pesos confidence level = 99% MOE = 10000…
Q: If the coefficient of determination is 0.90, the percentage of variation in the dependent variable…
A: “Since you have asked multiple questions, we will solve the first question for you. If you want any…
Q: Members of fraternities and sororities are required to volunteer for community service. Do…
A: The objective of the study is to test whether fraternity brothers work fewer volunteer hours on…
Q: The following plot shows the probability function of a random variable X. Estimate the needed…
A: From the given plot Find p (x =-1 ) =?
Q: a) What is the value of k? (b) Find E(X) and o (X). (c) Suppose the number of book reports students…
A: here given discrete probability distribution of X where X = number of book reports a student has…
Q: 5. Cellphone number are at what level of measurement? A. Nominal B. Ordinal O C. Interval D. Ratio
A: Cellphone number are at what level of measurement ? Answer : Option ( A ) Nominal
Q: The following figure is a probability density curve that represents the grade point averages (GPA)…
A:
Q: (a) Construct a 90% confidence interval for o? if the sample size, n, is 20. The lower bound is…
A: here given sample variance = s2 = 12.1
Q: Treatment Sham Researchers conducted a study to determine whether magnets are effective in treating…
A:
Q: The following information regarding a dependent variable Y and an independent variable X is…
A: N=4 Sx=16 Sy=28 SSxy=-8 SSx=8 SSy=SST=42 We have to choose correct option.
Q: Determine whether the outcome is a Type I error, a Type II error, or a correct decision. A test is…
A:
Q: The daily water level in Angat Dam is reported in batches of 30 day periods. During the dry season…
A:
Q: 9. In a gambling game, a man is paid P3 if he draws a jack or queen and P5 if he draws a king or ace…
A: As per bartleby guideline expert have to answer first question only.
Q: Nhen randomly selecting adults, let M denote the event of randomly selecting a male and let B denote…
A: When randomly selecting adults, let M denote the event of randomly selecting a male and let B denote…
Q: The following information regarding a dependent variable Y and an independent variable X is…
A: Given Information: Dependent variable=YIndependent variable=XSX=16SY=28n=4S(X-x) (Y-y)=-8S(X-x)2=8…
Q: One year, the mean age of an inmate on death row was 38.8 years. A sociologist wondered whether the…
A:
Q: The graph of the discrete probability to the right represents the number of live births by a mother…
A: Let x be the discrete random variable and it said to follows the probability mass fucntion with the…
Q: In the previous problem, a randomized double-blind experiment was done to test the effectiveness of…
A: Given data: Drug group: 8, 2, 3, 5 Placebo group: 3, -5, -2 Nothing group: -1, -3, -2
Q: 28-29. The coefficient of variation of the height of 20 people selected at random from a given city…
A: here given coefficient of variation in height = 0.15
Q: na large clinical trial, 397,626 children were randomly assigned to two groups. The treatment group…
A:
Q: 2. According to the National Association of Home Builders, the average cost of building a home in…
A: Given : Sample size (n) = 36 Sample mean (X¯) = $122.57 Sample SD (S) = $20 Significance level (α) =…
Q: Following safety protocols, Starburst serves its customers with a mean time of 7.5 minutes which…
A:
Q: The numbers 1, 2, 3 and 4 are written separately on four slips of The slips are put in a box and…
A:
Q: a. Use the sample data with a 0.01 significance level to test the claim that for the population of…
A: aa) Use the Paired t test PAIRED-T TEST The dependent variable must be continuous. When data are…
Q: The average time it takes a music producer to complete a recording of a pop song is 53.4 minutes.…
A: Let X be the random variable from normal distribution with mean (μ) = 53.4, variance (σ2) = 49 the…
Q: Members of fraternities and sororities are required to volunteer for community service. Do…
A: Given that We have to conduct hypothesis testing for difference of two…
Q: Researchers at an epidemiology clinic are interested in the difference in the incidence of a number…
A: The following information has been given: The sample size n1=1789. The sample size n2=1024. The…
Q: 12. A lecturer wanted to know the percentage of students who enjoy his lectures. A random sample of…
A: Given : Sample size of student (n) = 20 Let X : No. of students who enjoy lectures of a lecturer…
Q: Illustration Solution 6. z> -2.05 -2 -1 7. z -1.75 -2 -1 1 9. 0.66 z > 2.04
A:
Q: 27. What will happen to the mean if each observation is increased to half the value of the mean? A.…
A: Solution-: What will happen to the mean if each observation is increased to half the value of the…
Q: Question 6 (For question 6, just write down the answer. No explanation is needed.) (a) Sam and Peter…
A:
Q: Listed below are systolic blood pressure measurements (mm Hg) taken from the right and left arms of…
A: The question is based on a paired sample t test Given : Level of signif. ( α ) = 0.05
Step by step
Solved in 2 steps
- Spacers are manufactured to the mean dimension and tolerance shown in Figure 29-12. An inspector measures 10 spacers and records the following thicknesses: 0.372" 0.376" 0.379" 0.375" 0.370" 0.373" 0.377" 0.378" 0.371" 0.380" Which spacers are defective (above the maximum limit or below the minimum limit)? All dimensions are in inches.The following data set provides information about the City of Somerville Assessors Valuation for the fiscal year 2016. Building Type Land Area in Acres Living Area Total Assessed Land Value Total Assessed Parcel ValueCommercial 0.20860882 318 625900 730700Commercial 0.21751607 3630 423700 741100Commercial 5.5474977 59506 10253200 13547100Commercial 0.18682277 3780 293300 460200Commercial 0.55227273 22017 681300 1214000Condominium 0…Create a boxplot by calculating the appropriate quartiles Q1 and Q3. 15 12 6.2 7 5.5 2 4 5 10 11 7 6 4 7 01 5 3.2 4 10 6 2 10 1.5 5.1 6.4 8 14 3 2 mean: =6.09667 median:= 5.3
- The following data represent the square footage of 10 three-bedroom condos for sale in Hilton Head, South Carolina. 1,559 ------ 1,625 ------ 1,167 ------ 1,264 ------ 1,676 ------ 1,300 ------ 2,058 ------ 1,126 ------ 1,858 ------ 1,321 Determine the interquartile range for this sample. Are there any outliers in this data set?The following shows AIDS patients who are exposed and not exposed to IV drug use and mortality after a follow-up of certain years. Exposed subjects (n = 300): Person-years observation = 6000 and deaths = 30 Unexposed subjects (n = 400): Person-years observation = 6000 and deaths = 10 Calculate and interpret the following: Cumulative incidence rate for each group Incidence rate for each group (incidence density) Risk ratio and Risk differenceThe following data has been collected on the interarrival times of patients to an emergency department: 3.772, 1.761, 0.743, 15.988, 0.412, 7.541, 6.900, 3.447, 7.024, 1.061, 5.449, 0.309, 0.766, 4.807, 8.143, 0.093, 9.524, 0.012, 4.634, and 0.195 minutes. Estimate the squared coefficient of variation of the arrival process. Is the arrival process likely to be Poisson? Why or why not? Estimate the arrival rate?
- Zhanna Butulyan, a consumer analyst collected the following data on the screen sizes of popular LCD televisions sold recently at a large retailer: Manufacturer Screen Price Sharp 46 $1,473.00 Samsung 52 2300 Samsung 46 1790 Sony 40 1250 Sharp 42 1546.5 Samsung 46 1922.5 Samsung 40 1372 Sharp 37 1149.5 Sharp 46 2000 Sony 40 2100 Sony 52 2615 Samsung 32 890.2 Sharp 37 1314.5 Sharp 32 853.5 Sharp 52 2778 Samsung 40 1749.5 Sharp 32 1035 Samsung 52 3100 Sony 40 1954 Sony 52 3210 Sony 46 2701 Sony 46 2899 Sony 52 4100 Samsung 46 1922.5 Samsung 40 1755 Sharp 37 1258 Sharp 46 2210 Samsung 40 785.2 Sharp 41 1500 Sharp 30 855 Sharp 55 3000 Leave your answer in 3 decimal places Find the Regression Equation y= + xThe National Hurricane Center provides data that list the number of large (category 3, 4, or 5) hurricanes that have struck the United States, by decade, from 1851-2020. Is there sufficient evidence that the number of large hurricanes have remained constant (per decade)? What are the degrees of freedom? Decade Count Decade Count 1851-1860 6 1941-1950 10 1861-1870 1 1951-1960 8 1871-1880 7 1961-1970 6 1881-1890 5 1971-1980 4 1891-1900 8 1981-1990 5 1901-1910 4 1991-2000 5 1911-1920 7 2001-2010 8 1921-1930 5 2011-2020 10 1931-1940 8 Chi-squared test for given probabilitiesdata: stormsX-squared = 13.589, df = 16, p-value = 0.6293 A. 107 B. 17 C. 13.589 D. 16Follow the eight famous steps to test whether the means of case rate per 100,000 among three groups of states (swing states, solid red states, and solid blue states) are different Political affiliation: Swing States State Case Rate per 100,000 GDP Per Capita in Q2 2020 ($) Arizona 5,079 48,105 Florida 4,886 47,802 Georgia 4,766 54,696 Michigan 4,271 47,612 Nevada 5,541 50,783 North Carolina 3,804 52,133 Pennsylvania 3,280 56,540 Wisconsin 7,587 53,934 Political affiliation: Solid Red States State Case Rate per 100,000 GDP Per Capita in Q2 2020 ($) Arkansas 5,671 40,033 Indiana 5,703 51,102 Kansas 5,780 55,423 Nebraska 7,248 61,875 Kentucky 4,490 43,396 Oklahoma 5,224 43,736 Tennessee 5,917 48,790 Wyoming 6,286 57,421 Political affiliation: Solid Blue States State Case Rate per 100,000 GDP Per Capita in Q2 2020 ($) California 3,392 73,219 Colorado 4,575 63,384 Connecticut 3,575 73,685 Maryland 3,596 65,933 Massachusetts 3,730…