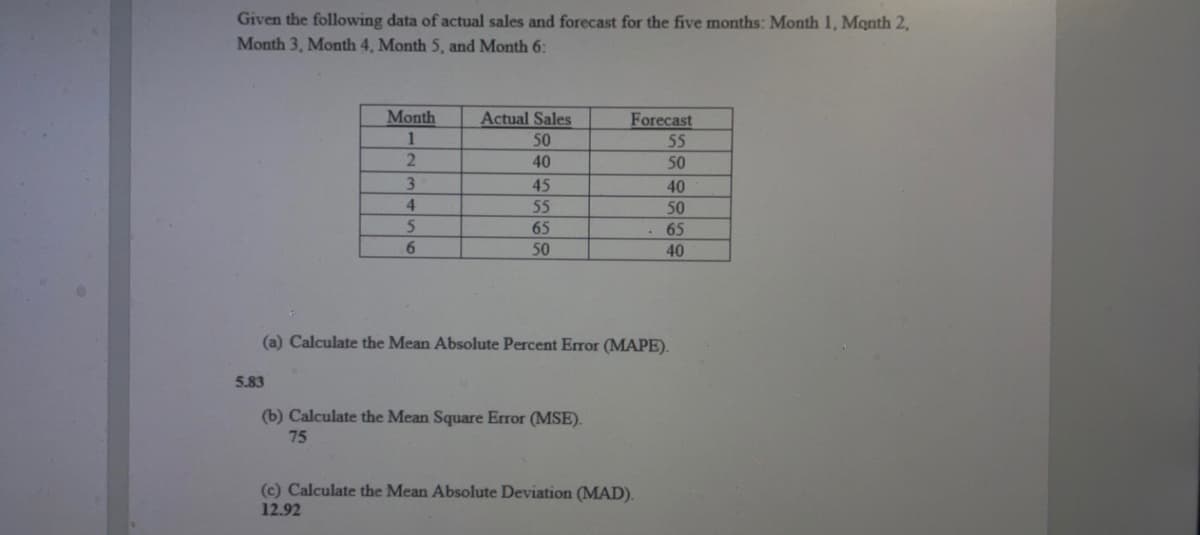
Given the following data of actual sales and forecast for the five months: Month 1, Month 2, Month 3, Month 4, Month 5, and Month 6: Month 1 2 5.83 3 4 5 6 Actual Sales 50 40 45 55 65 50 Forecast 55 50 (a) Calculate the Mean Absolute Percent Error (MAPE). (b) Calculate the Mean Square Error (MSE). 75 40 50 65 40 (c) Calculate the Mean Absolute Deviation (MAD). 12.92
Q: Provide the following: labor productivity of Old and New System (shopping cart per dollar of labor)…
A: Productivity is the relationship between the volume of the input and output that is calculated in…
Q: A Transportation Problem with 5 supply and 6 demand points (Unbalanced) TO (Destination)…
A:
Q: From several years’ records, a fish market manager has determined that the weight of deep sea bream…
A: The z-score is used to measure the statistical significance of a data point. The z-score is…
Q: A manufacturer of precision machine parts produces shafts for use in the construction of drill…
A: The X-bar charts and the R charts are generally used to evaluate the stability of the process and…
Q: 1) Find the time to complete this project assuming the given duration of each task is constant.…
A: A network diagram related to the project shows the sequence of the task that is performed to…
Q: high specifications, while the second type has normal specifications. The expected profit from…
A: Linear programming is a mathematical technique that is also used in operations management…
Q: nswer. Level output/workforce strategy: Monthly planning for all the products in same family…
A: The term "aggregate planning" is used to describe the process of developing, updating, and…
Q: A laundry soap is produced in a production line that has annual capacity of 120,000 cases. The…
A: Production is the process in which inputs are combined to have the required output. It includes a…
Q: RMC, Inc., is a small firm that produces a variety of chemical products. In a particular production…
A: i. value of objective function = $1633.33 Dual price: highlighted in yellow: note: dual price…
Q: A linear programming computer package is needed. of a of customers make reservations via phone.…
A: Given data is Day Minimum employees needed Monday 75 Tuesday 55 Wednesday 50 Thursday 70…
Q: Q5: Draw the following project and find the slack time and critical path on the network: Act 1-2 2-3…
A: A project schedule network diagram shows the sequence of the task that is performed to complete a…
Q: Find the maximal flow from source node the target node.
A: Maximum flow shows the path that takes the longest or the maximum values from one point to the…
Q: Explain the difference between a moving-average and an autoregressive process.
A: Moving-average and autoregressive process are the statistical model used for forecasting the values…
Q: The Warren W. Fisher Computer Corporation purchases 8,000 transistors each year as components in…
A: Given Data Annual demand (D) = 8000 transistors or units Ordering cost (S) = $30 per order Cost of…
Q: Access Accor's current distribution strategy. What is the value of the OTA relationship to the…
A: A distribution strategy is an approach to making accessible of a product or a service to its…
Q: global challenges in Supply Chain Management
A: The supply chain is a complicated system. It consists of a series of interconnected organizations,…
Q: What is the critical path and duration for this project?
A: A project schedule network diagram shows the sequence of the task that is performed to complete a…
Q: 12.1-2* A young couple, Eve and Steven, want to divide their main household chores (marketing,…
A: Objective Functions and Constraints: Based on the given details, the objective…
Q: John Francois Stores Mr. John Francois, a very successful businessman is contemplating his next…
A: Based on the above condition the 3 strategies are: 1) Client assistance improvement 2) Promoting…
Q: Identify two action items you intend to take forward into the workplace.
A: Business management generally focuses on arranging or organizing, planning, and analyzing the tasks…
Q: 1. Weenies and Buns is a food processing plant which manufactures hot dogs and hot dog buns. They…
A:
Q: Appraise Unilever on how they handled the controversial Tresemme advert, and the impact the advert…
A: In the promotional campaign every organisation aims to influence their customers to purchase that…
Q: The manager of a Burger Doodle franchise wants to determine how many sausage biscuits and ham…
A: Objective Functions and Constraints: Based on the given details, the objective…
Q: Using the provided template, show the steps to get the solution. During each four-hour period, the…
A: Find the Given details below: Given details: Starting 4 hours of 8-hour shift Midnight -…
Q: What is the purpose of supply chain management systems
A: Supply chain management system:- Supply chain management systems are tools to help businesses and…
Q: CASE 1. Mossaic Tiles, Ltd. Gilbert Moss and Angela Pasaic spent several summers during their…
A: Objective Functions and Constraints: Based on the given details, the objective…
Q: ert Moss and Angela Pasaic cal sites in the Southwest. Whil ter college they made use of th
A: Decision variables
Q: Discuss the purpose and procedures related to internal control.
A: Internal control is a process of minimizing risks and to reduce happening of fraud. Internal control…
Q: A local factory assembling calculators produces 400 units per month and sells them for P1,842 each.…
A: Production = 400 units per month Selling price (P) = P1842 per unit Fixed cost (F) = P50825 Variable…
Q: Draw the network (AON) and calculate and calculate the Critical Path
A: A network diagram related to the project shows the sequence of the task that is performed to…
Q: A department store sells 10 000 cameras per year. The store orders cameras from a regional…
A: EOQ stands for economic order quantity. It is a company's optimal order quantity that undervalues…
Q: Consider the following LP problem developed at Zafar Malik's Carbondale, Illinois, optical scanning…
A: Given data is Objective function: Max Z=X1+X2 Subject to constraints: 1.) 2X1+1X2≤602.)…
Q: B/ solve the following linear programming problem using graphical method Min (z) = 300x₁+200x2 S.T.…
A: A graphical method of linear programming is used to find an optimal solution to a linear program.…
Q: XYZ Print Inc. uses plain paper for copying needs. Weekly demand for that paper follows a normal…
A: Units to order = Order upto level - Onhand inventory - Order quantity Standard deviation in given…
Q: What is a scheduling technique used to achieve an optimal, one-to-one combination of tasks and…
A: Scheduling is the process of arranging the production activities in order to complete the…
Q: plain, What are the issues with Balanced Scorecard?
A: The Balanced Scorecard is a strategic management system developed by Dr. Robert S. Kaplan and Dr.…
Q: to this business. What are some of the challenges to managing the high quality of service in Lonely…
A: Lonely Planet offers guidebooks, mobile apps, and websites for global travelers. The firm also…
Q: Formulate the following problems as balanced assignment models: Person A is planning to organize a…
A: Quotations (in USD) for each time
Q: Under ideal conditions, a picture frame manufacturing facility can produce 480 frames per day. Under…
A: Given data Under the ideal scenario, a firm manufactures 480 frames in a day Under a normal…
Q: A quality control technique for tracing back from observed problems to likely causes is:…
A: The control chart is a graph that is used to study the changes within the process over the time…
Q: quested b. demand for individual products c. demand for product families d. the demand for the parts…
A: Option a is correct An aggregate plan provides justification for the budget amount requested
Q: Electronics, Inc., in Nashv ces sn runs of custom ain ve scanners for the defense industry. You have…
A: In a manufacturing process, a kanban system is a form of inventory control that uses cards or tags…
Q: Development of Version 2.0 of a particular accounting software product is being considered by Jose…
A: Note: - Since we can only answer the first three subparts we will answer(a, b, and c) here. Please…
Q: Max X s.t. Regular % constraint 0 X DeCaf % constraint 0 X Pounds of Regular 800 X Pounds of DeCaf…
A: Objective Functions and Constraints: Based on the given details, the objective…
Q: CA Corporate has an available funds of $200,000 is considering for new investment opportunities. The…
A: Investment portfolio of stocks is given as follows:
Q: PA 5-12 (Static) A pharmaceutical company creates... A pharmaceutical company creates a compound…
A: Process yield can be stated as the approach that is used in producing or manufacturing to determine…
Q: please assist with the following Purchasing and supply management is an integrated part of an…
A: Supply chain management is controlling the entire production flow of goods or services. This process…
Q: Describe a list of activities that are required for an effective project closure.
A: Project closure is the crucial and last stage in the project management lifecycle. This is the phase…
Q: Frank’s Contract Bakery measured her 2021 Cost of Goods Sold to be 6516265. Her Average Aggregate…
A: Days of supply = (Average inventory on hand/cost of goods sold)*365 days Average inventory on hand =…
Q: a. Define the variables used and formulate the linear programming model for this problem..
A: Linear programming is a mathematical technique that is also used in operations management…
Step by step
Solved in 4 steps with 7 images
- Under what conditions might a firm use multiple forecasting methods?The Baker Company wants to develop a budget to predict how overhead costs vary with activity levels. Management is trying to decide whether direct labor hours (DLH) or units produced is the better measure of activity for the firm. Monthly data for the preceding 24 months appear in the file P13_40.xlsx. Use regression analysis to determine which measure, DLH or Units (or both), should be used for the budget. How would the regression equation be used to obtain the budget for the firms overhead costs?The file P13_42.xlsx contains monthly data on consumer revolving credit (in millions of dollars) through credit unions. a. Use these data to forecast consumer revolving credit through credit unions for the next 12 months. Do it in two ways. First, fit an exponential trend to the series. Second, use Holts method with optimized smoothing constants. b. Which of these two methods appears to provide the best forecasts? Answer by comparing their MAPE values.
- The owner of a restaurant in Bloomington, Indiana, has recorded sales data for the past 19 years. He has also recorded data on potentially relevant variables. The data are listed in the file P13_17.xlsx. a. Estimate a simple regression equation involving annual sales (the dependent variable) and the size of the population residing within 10 miles of the restaurant (the explanatory variable). Interpret R-square for this regression. b. Add another explanatory variableannual advertising expendituresto the regression equation in part a. Estimate and interpret this expanded equation. How does the R-square value for this multiple regression equation compare to that of the simple regression equation estimated in part a? Explain any difference between the two R-square values. How can you use the adjusted R-squares for a comparison of the two equations? c. Add one more explanatory variable to the multiple regression equation estimated in part b. In particular, estimate and interpret the coefficients of a multiple regression equation that includes the previous years advertising expenditure. How does the inclusion of this third explanatory variable affect the R-square, compared to the corresponding values for the equation of part b? Explain any changes in this value. What does the adjusted R-square for the new equation tell you?The file P13_22.xlsx contains total monthly U.S. retail sales data. While holding out the final six months of observations for validation purposes, use the method of moving averages with a carefully chosen span to forecast U.S. retail sales in the next year. Comment on the performance of your model. What makes this time series more challenging to forecast?The file P13_26.xlsx contains the monthly number of airline tickets sold by the CareFree Travel Agency. a. Create a time series chart of the data. Based on what you see, which of the exponential smoothing models do you think will provide the best forecasting model? Why? b. Use simple exponential smoothing to forecast these data, using a smoothing constant of 0.1. c. Repeat part b, but search for the smoothing constant that makes RMSE as small as possible. Does it make much of an improvement over the model in part b?
- The file P13_02.xlsx contains five years of monthly data on sales (number of units sold) for a particular company. The company suspects that except for random noise, its sales are growing by a constant percentage each month and will continue to do so for at least the near future. a. Explain briefly whether the plot of the series visually supports the companys suspicion. b. By what percentage are sales increasing each month? c. What is the MAPE for the forecast model in part b? In words, what does it measure? Considering its magnitude, does the model seem to be doing a good job? d. In words, how does the model make forecasts for future months? Specifically, given the forecast value for the last month in the data set, what simple arithmetic could you use to obtain forecasts for the next few months?The file P13_29.xlsx contains monthly time series data for total U.S. retail sales of building materials (which includes retail sales of building materials, hardware and garden supply stores, and mobile home dealers). a. Is seasonality present in these data? If so, characterize the seasonality pattern. b. Use Winters method to forecast this series with smoothing constants = = 0.1 and = 0.3. Does the forecast series seem to track the seasonal pattern well? What are your forecasts for the next 12 months?Consider the following time series data. Week 1 2 3 4 5 6 Value 18 12 15 11 18 13 Using the naïve method (most recent value) as the forecast for the next week, compute the following measures of forecast accuracy. (a) Mean absolute error If required, round your answer to one decimal place. (b) Mean squared error If required, round your answer to one decimal place. (c) Mean absolute percentage error If required, round your intermediate calculations and final answer to two decimal places. (d) What is the forecast for week 7?
- Using the photo attached, answer the following: 1. Using a numerical example, demonstrate to Mr. John how he can use the manual trend projection method of forecasting to forecast demand for the next two years.The monthly demand for units manufactured by the Acme Rocket Company has been as follows: a. Use the exponential smoothing method to forecast the number of units for June to January. Theinitial forecast for May was 105 units; a = 0.2.b. Calculate the absolute percentage error for each month from June through December and theMAD and MAPE of forecast error as of the end of December.c. Calculate the tracking signal as of the end of December. What can you say about the performanceof your forecasting method?Please show work in excel Sales for the past 12 months at Schumacher & Company’s U.S. Retail Division are given below. a) Use a three-month moving average to forecast sales for the months April through December. b) Use the exponential smoothing method to forecast sales for the months of February through December. Use alpha = 0.6, and assume that the forecast for January was 47. c) Compare the performance of these two methods for the months of April through December using the mean squared error (MSE) as the performance criterion. Which method would you recommend? MONTH SALES Jan 52 Feb 60 Mar 54 Apr 36 May 40 Jun 47 Jul 25 Aug 27 Sep 25 Oct 36 Nov 32 Dec 28