Given the following histograms, determine whether the mean is greater than (>), less than (<) , or pproximately equal (=) to the median. Write only the symbol in your answer.
Given the following histograms, determine whether the mean is greater than (>), less than (<) , or pproximately equal (=) to the median. Write only the symbol in your answer.

Glencoe Algebra 1, Student Edition, 9780079039897, 0079039898, 2018
18th Edition
ISBN:9780079039897
Author:Carter
Publisher:Carter
Chapter10: Statistics
Section10.5: Comparing Sets Of Data
Problem 1GP

Related questions
Question
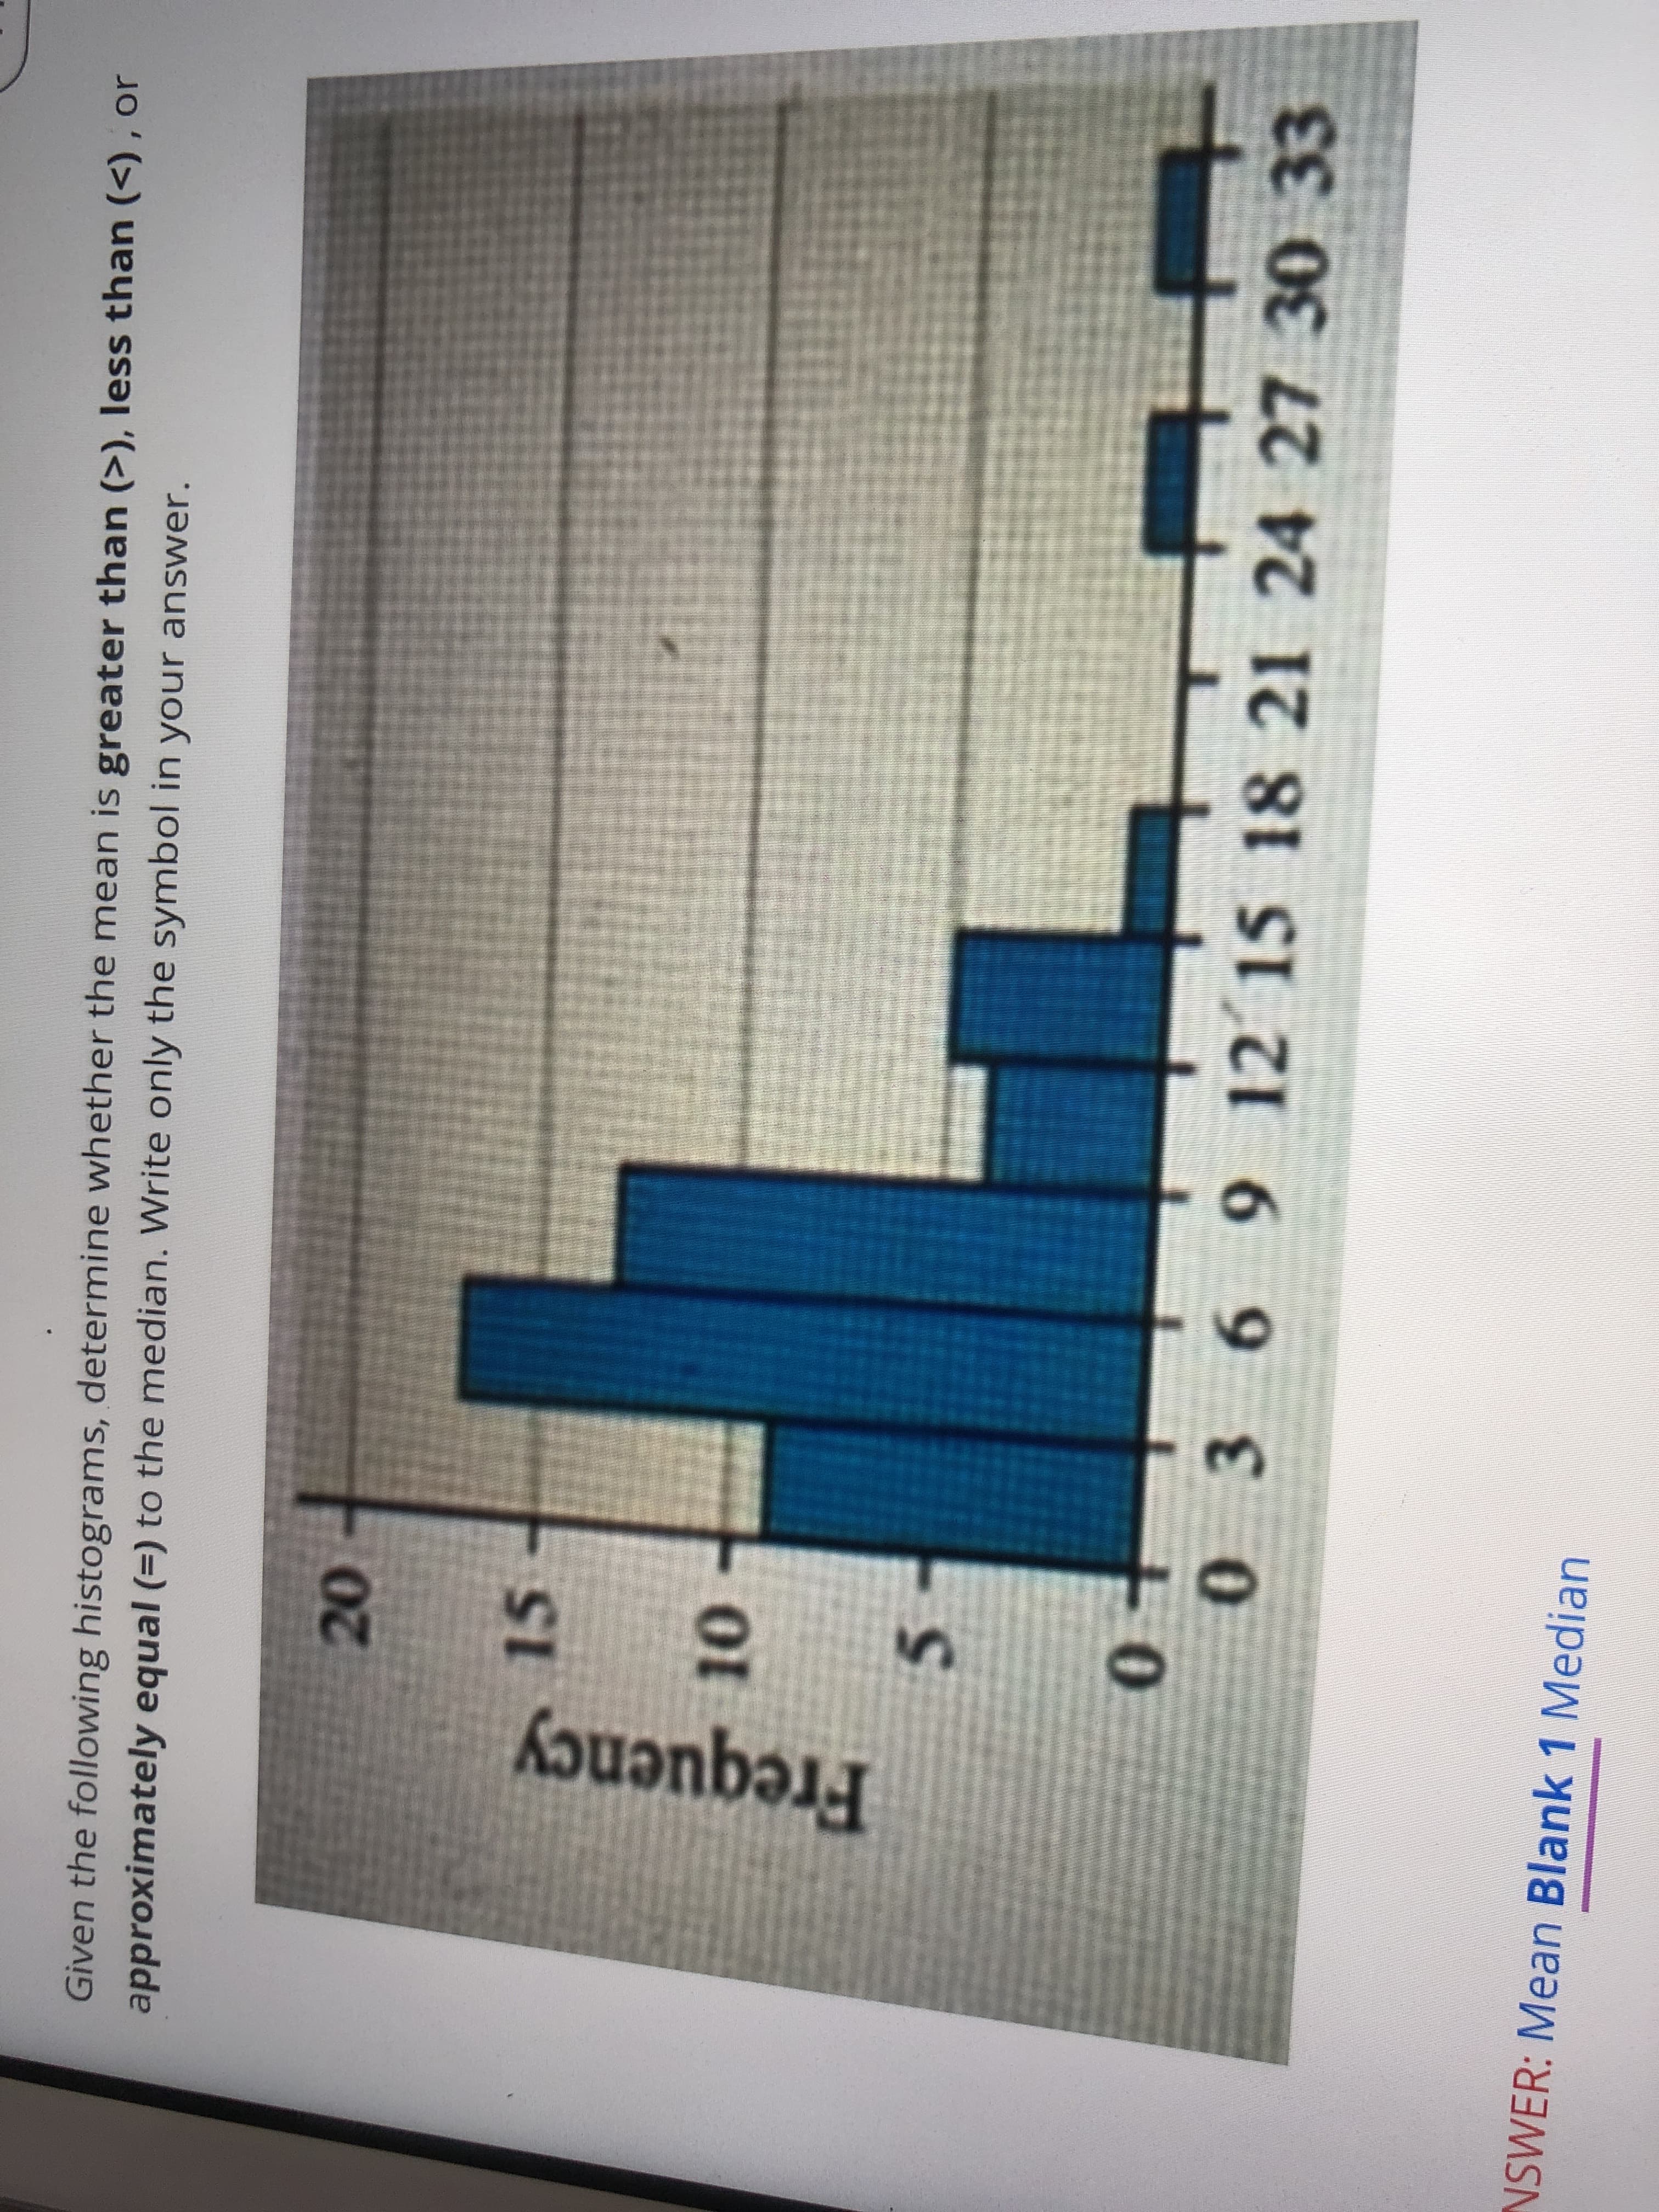
Transcribed Image Text:Given the following histograms, determine whether the mean is greater than (>), less than (<) , or
approximately equal (=) to the median. Write only the symbol in your answer.
20
03
6 9 12 15 18 21 24 27 30 33
NSWER: Mean Blank 1 Median
Frequency
Expert Solution
This question has been solved!
Explore an expertly crafted, step-by-step solution for a thorough understanding of key concepts.

Step by step
Solved in 2 steps

Recommended textbooks for you
Glencoe Algebra 1, Student Edition, 9780079039897…
Algebra
ISBN:
9780079039897
Author:
Carter
Publisher:
McGraw Hill
Glencoe Algebra 1, Student Edition, 9780079039897…
Algebra
ISBN:
9780079039897
Author:
Carter
Publisher:
McGraw Hill