Refer to the following students score data: Score 11-14 15-18 19-22 23-26 27-30 31-34 35-38 Frequency 4. 7. 10 12 7. What is the mean score of the students Score data?
Refer to the following students score data: Score 11-14 15-18 19-22 23-26 27-30 31-34 35-38 Frequency 4. 7. 10 12 7. What is the mean score of the students Score data?

Glencoe Algebra 1, Student Edition, 9780079039897, 0079039898, 2018
18th Edition
ISBN:9780079039897
Author:Carter
Publisher:Carter
Chapter10: Statistics
Section10.5: Comparing Sets Of Data
Problem 1GP

Related questions
Question
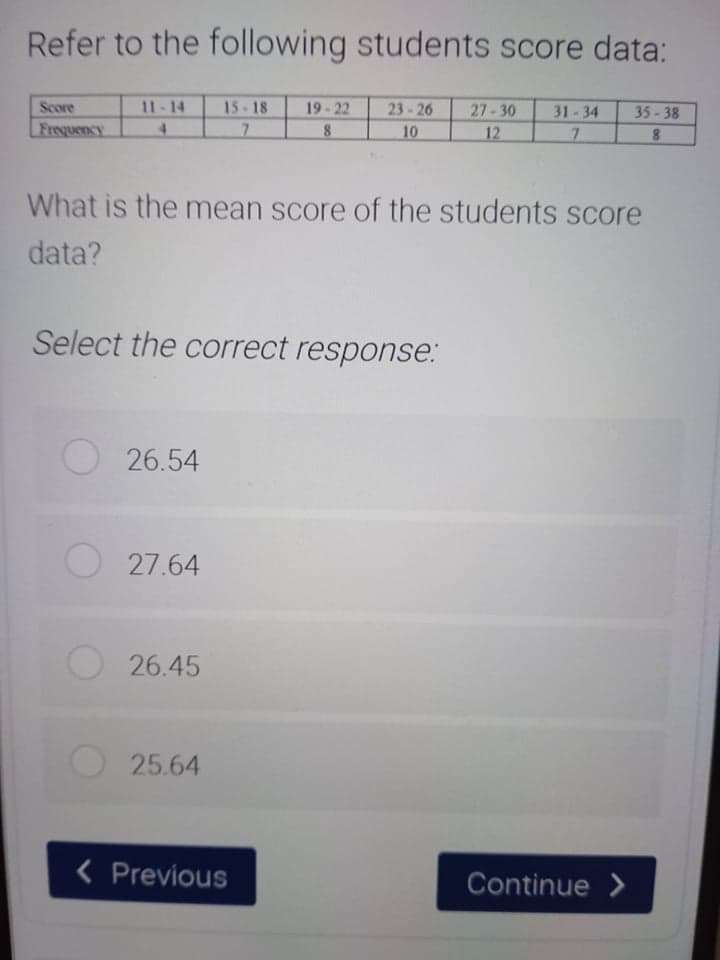
Transcribed Image Text:Refer to the following students score data:
Score
11-14
15- 18
19-22
23-26
27-30
31-34
35-38
Frequency
4.
8
10
12
7.
8.
What is the mean score of the students score
data?
Select the correct response:
26.54
27.64
26.45
25.64
< Previous
Continue >
Expert Solution
This question has been solved!
Explore an expertly crafted, step-by-step solution for a thorough understanding of key concepts.

Step by step
Solved in 2 steps

Recommended textbooks for you
Glencoe Algebra 1, Student Edition, 9780079039897…
Algebra
ISBN:
9780079039897
Author:
Carter
Publisher:
McGraw Hill
Glencoe Algebra 1, Student Edition, 9780079039897…
Algebra
ISBN:
9780079039897
Author:
Carter
Publisher:
McGraw Hill