Given the following outcomes from a random sample of 15 people's weekly expenditure on fruit: 16; 13; 7; 7; 3; 6; 8; 7; 10; 2; 10; 7; 8; 14; 12. What is the interquartile range for the level of expenditure on fruit? 04 05 03 O 4.5
Given the following outcomes from a random sample of 15 people's weekly expenditure on fruit: 16; 13; 7; 7; 3; 6; 8; 7; 10; 2; 10; 7; 8; 14; 12. What is the interquartile range for the level of expenditure on fruit? 04 05 03 O 4.5

Glencoe Algebra 1, Student Edition, 9780079039897, 0079039898, 2018
18th Edition
ISBN:9780079039897
Author:Carter
Publisher:Carter
Chapter10: Statistics
Section10.4: Distributions Of Data
Problem 19PFA

Related questions
Question
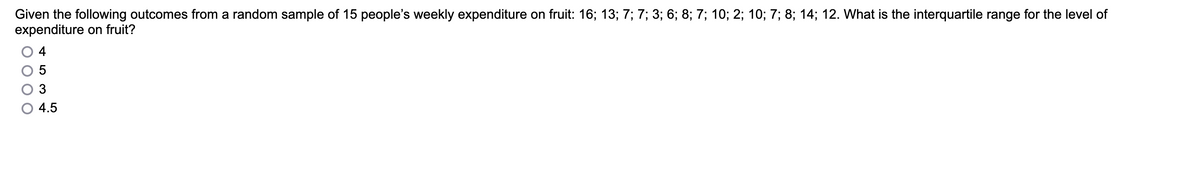
Transcribed Image Text:Given the following outcomes from a random sample of 15 people's weekly expenditure on fruit: 16; 13; 7; 7; 3; 6; 8; 7; 10; 2; 10; 7; 8; 14; 12. What is the interquartile range for the level of
expenditure on fruit?
4
3
4.5
Expert Solution
This question has been solved!
Explore an expertly crafted, step-by-step solution for a thorough understanding of key concepts.

Step by step
Solved in 3 steps

Recommended textbooks for you
Glencoe Algebra 1, Student Edition, 9780079039897…
Algebra
ISBN:
9780079039897
Author:
Carter
Publisher:
McGraw Hill
Glencoe Algebra 1, Student Edition, 9780079039897…
Algebra
ISBN:
9780079039897
Author:
Carter
Publisher:
McGraw Hill