Given the SPSS output (a)Are the samples independent? Justify your answer. (b)State the appropriate null and alternative hypotheses to test whether the medication has been effective in decreasing blood glucose level. c) Calculate the value of the test statistic and test the hypotheses assuming α = 0.05 using critical value-approach. d) Find the p-value. NOTE: Hypotheses should be written using notation μD and indicate how you obtain the difference D = Before Medication - After Medication or D = After Medication - Before Medication which my alter your hypotheses. Although SPSS provides p-value (i.e. Sig-(2-tailed) in SPSS output) assuming the test is two-tailed, students need to divide the SPSS p-value by 2 to get the right p-value for our right-tailed test. This problem also needs to be solved using critical value approach. You need to find the critical value from the t-table as critical value is usually not reported in SPSS output and carry out all 4-step process to do the hypothesis test.


Given the SPSS output
(a)Are the samples independent? Justify your answer.
(b)State the appropriate null and alternative hypotheses to test whether the medication has been effective in decreasing blood glucose level.
c) Calculate the value of the test statistic and test the hypotheses assuming α = 0.05 using critical value-approach.
d) Find the p-value.
NOTE:
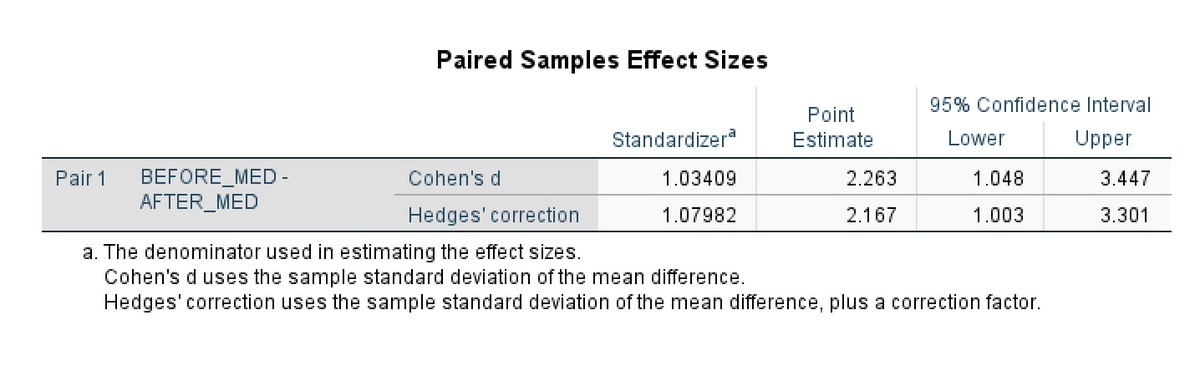
Hypotheses should be written using notation μD and indicate how you obtain the difference D = Before Medication - After Medication or D = After Medication - Before Medication which my alter your hypotheses.
Although SPSS provides p-value (i.e. Sig-(2-tailed) in SPSS output) assuming the test is two-tailed, students need to divide the SPSS p-value by 2 to get the right p-value for our right-tailed test. This problem also needs to be solved using critical value approach. You need to find the critical value from the t-table as critical value is usually not reported in SPSS output and carry out all 4-step process to do the hypothesis test.
![T-Test
[DataSet2]
Paired Samples Statistics
Std. Error
Mean
Std. Deviation
Mean
Pair 1
BEFORE_MED
11.4000
10
1.02956
.32558
AFTER_MED
9.0600
10
1.44160
.45588
Paired Samples Correlations
Correlation
Sig.
BEFORE_MED &
AFTER_MED
Pair 1
10
.697
.025
Paired Samples Test
Paired Differences
95% Confidence Interval of the
ferenc
Std. Error
Mean
Std. Deviation
Mean
Lower
Upper
df
Sig. (2-tailed)
BEFORE_MED-
AFTER_MED
Pair 1
2.34000
1.03409
.32701
1.60026
3.07974
7.156
9
.000](/v2/_next/image?url=https%3A%2F%2Fcontent.bartleby.com%2Fqna-images%2Fquestion%2F745dba5c-d13f-47d6-a00d-c0f6eadf759a%2F92f1d4dd-c739-4d71-9646-9875433e32c1%2F6rlxwsn_processed.png&w=3840&q=75)

Step by step
Solved in 6 steps with 2 images


