Given the values in Part 1. Check if the sample data truly represents the population data at 5% level of significance using hypothesis testing in one variable. a. Construct the null and alternative hypothesis b. Use the MS Excel Data Analysis toolpak to compute the p-value Weight:74,58,59,35,69,48,76,60,57 Class Data Measurement#1 Weight: 68,43,42,55,4043,60,52,48,74,58,59,35,69,48,76,60,57,56,41,55,39,84,64,54,53,51,68,69,69,69,66,55,40 ,52 Population mean(weight): 56.342857 Population Variance(weight): 139.42531 Population Standard Deviation(weight): 11.807849
Given the values in Part 1. Check if the sample data truly represents the population data at 5% level of significance using hypothesis testing in one variable. a. Construct the null and alternative hypothesis b. Use the MS Excel Data Analysis toolpak to compute the p-value Weight:74,58,59,35,69,48,76,60,57 Class Data Measurement#1 Weight: 68,43,42,55,4043,60,52,48,74,58,59,35,69,48,76,60,57,56,41,55,39,84,64,54,53,51,68,69,69,69,66,55,40 ,52 Population mean(weight): 56.342857 Population Variance(weight): 139.42531 Population Standard Deviation(weight): 11.807849

Holt Mcdougal Larson Pre-algebra: Student Edition 2012
1st Edition
ISBN:9780547587776
Author:HOLT MCDOUGAL
Publisher:HOLT MCDOUGAL
Chapter11: Data Analysis And Probability
Section11.4: Collecting Data
Problem 3E

Related questions
Question
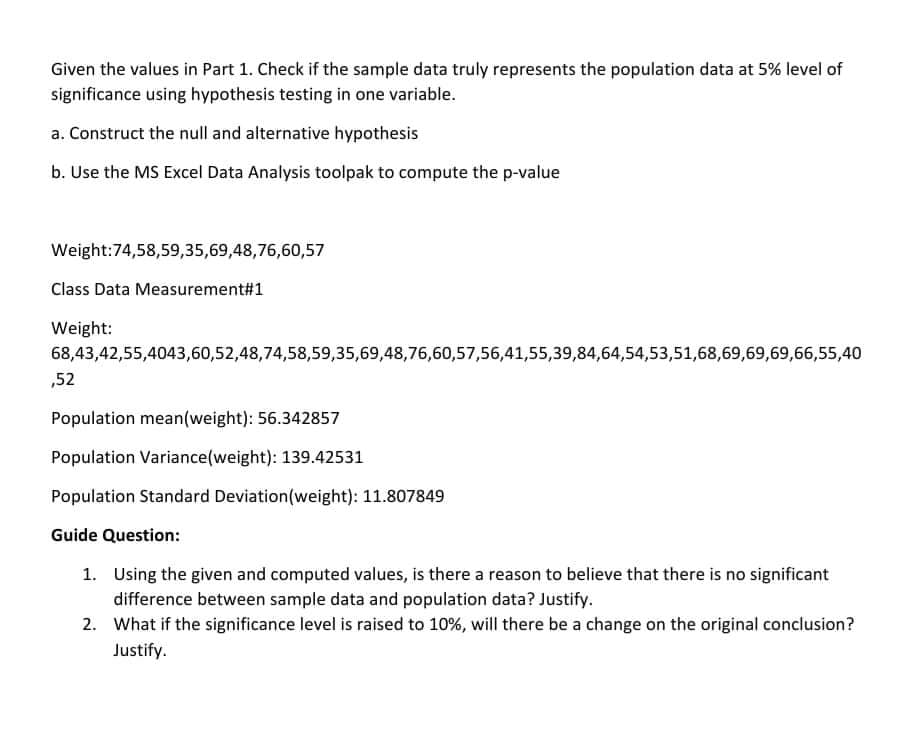
Transcribed Image Text:Given the values in Part 1. Check if the sample data truly represents the population data at 5% level of
significance using hypothesis testing in one variable.
a. Construct the null and alternative hypothesis
b. Use the MS Excel Data Analysis toolpak to compute the p-value
Weight:74,58,59,35,69,48,76,60,57
Class Data Measurement#1
Weight:
68,43,42,55,4043,60,52,48,74,58,59,35,69,48,76,60,57,56,41,55,39,84,64,54,53,51,68,69,69,69,66,55,40
,52
Population mean(weight): 56.342857
Population Variance(weight): 139.42531
Population Standard Deviation(weight): 11.807849
Guide Question:
1. Using the given and computed values, is there a reason to believe that there is no significant
difference between sample data and population data? Justify.
2. What if the significance level is raised to 10%, will there be a change on the original conclusion?
Justify.
Expert Solution
This question has been solved!
Explore an expertly crafted, step-by-step solution for a thorough understanding of key concepts.

Step by step
Solved in 2 steps with 1 images

Recommended textbooks for you
Holt Mcdougal Larson Pre-algebra: Student Edition…
Algebra
ISBN:
9780547587776
Author:
HOLT MCDOUGAL
Publisher:
HOLT MCDOUGAL

College Algebra (MindTap Course List)
Algebra
ISBN:
9781305652231
Author:
R. David Gustafson, Jeff Hughes
Publisher:
Cengage Learning

Glencoe Algebra 1, Student Edition, 9780079039897…
Algebra
ISBN:
9780079039897
Author:
Carter
Publisher:
McGraw Hill
Holt Mcdougal Larson Pre-algebra: Student Edition…
Algebra
ISBN:
9780547587776
Author:
HOLT MCDOUGAL
Publisher:
HOLT MCDOUGAL
College Algebra (MindTap Course List)
Algebra
ISBN:
9781305652231
Author:
R. David Gustafson, Jeff Hughes
Publisher:
Cengage Learning
Glencoe Algebra 1, Student Edition, 9780079039897…
Algebra
ISBN:
9780079039897
Author:
Carter
Publisher:
McGraw Hill
