gives the population and earnings of two town A and B. Represent the data graphically so as to bring out the inequlity of the distribution of earnings. Town A Town B Persons Earning (Daily) Persons Earning (Daily) 80 120 60 100 75 50 100 70 100 100 150 30 225 25 140 100 325 100 200 100 375 45 200 100 450 30 140 100 600 80 460 100 850 20 120 100 100 1,850 50 480 5,000 50 2,000 1,000
gives the population and earnings of two town A and B. Represent the data graphically so as to bring out the inequlity of the distribution of earnings. Town A Town B Persons Earning (Daily) Persons Earning (Daily) 80 120 60 100 75 50 100 70 100 100 150 30 225 25 140 100 325 100 200 100 375 45 200 100 450 30 140 100 600 80 460 100 850 20 120 100 100 1,850 50 480 5,000 50 2,000 1,000

Glencoe Algebra 1, Student Edition, 9780079039897, 0079039898, 2018
18th Edition
ISBN:9780079039897
Author:Carter
Publisher:Carter
Chapter4: Equations Of Linear Functions
Section4.5: Correlation And Causation
Problem 21PFA

Related questions
Question
100%
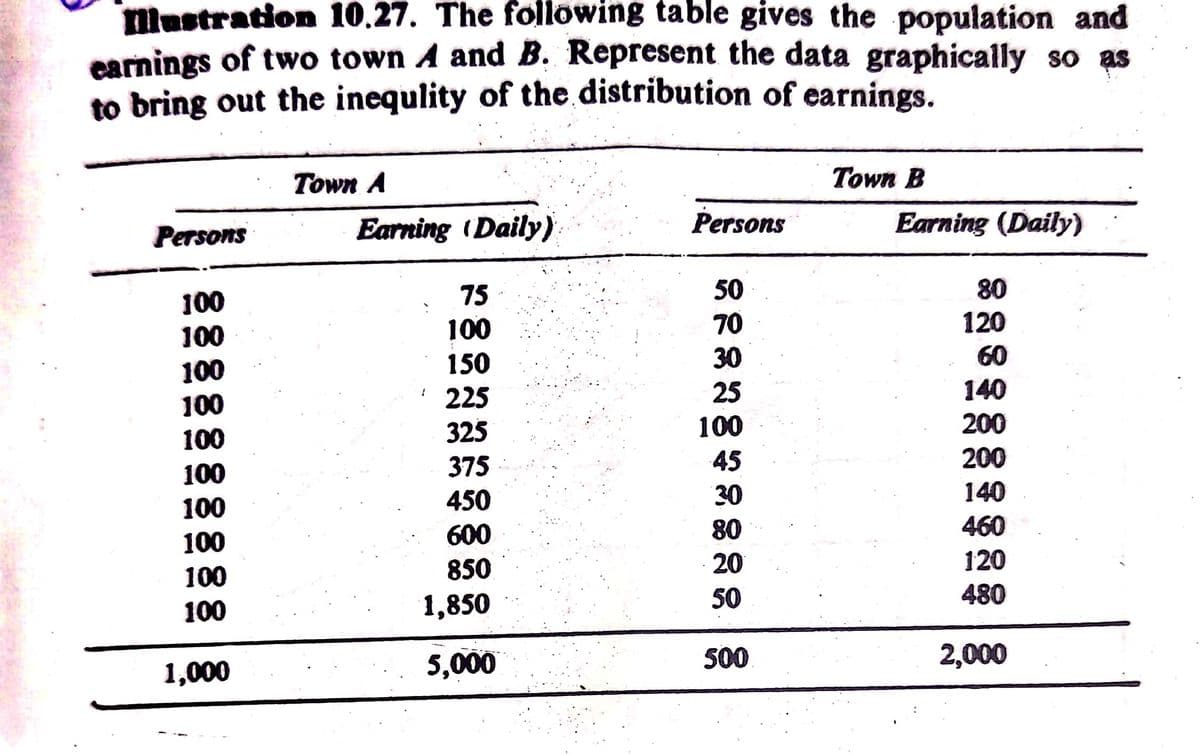
Transcribed Image Text:ustration 10.27. The following table gives the population and
earnings of two town A and B. Represent the data graphically so as
to bring out the inequlity of the distribution of earnings.
Town A
Town B
Persons
Earning (Daily)
Persons
Earning (Daily)
80
120
100
75
50
100
70
100
150
30
60
100
100
225
25
140
325
100
200
100
375
45
200
100
450
30
140
100
600
80
460
100
850
20
120
100
100
1,850
50
480
1,000
5,000
S00
2,000
Expert Solution
This question has been solved!
Explore an expertly crafted, step-by-step solution for a thorough understanding of key concepts.

Step by step
Solved in 3 steps with 3 images

Recommended textbooks for you
Glencoe Algebra 1, Student Edition, 9780079039897…
Algebra
ISBN:
9780079039897
Author:
Carter
Publisher:
McGraw Hill

Algebra & Trigonometry with Analytic Geometry
Algebra
ISBN:
9781133382119
Author:
Swokowski
Publisher:
Cengage
Glencoe Algebra 1, Student Edition, 9780079039897…
Algebra
ISBN:
9780079039897
Author:
Carter
Publisher:
McGraw Hill
Algebra & Trigonometry with Analytic Geometry
Algebra
ISBN:
9781133382119
Author:
Swokowski
Publisher:
Cengage