15. What are the data values (raw scores) associated with standard scores of -0.09 and 1.15? Determine the percentage in between these scores. Draw the curve and show your complete solution. A.0.nceco eng - 0.0. *- .33 0. qiro Te PNTe nN M LIS The percentage that is in between the raw scores of 8.2474 and 9.3857 is 33.9%.
15. What are the data values (raw scores) associated with standard scores of -0.09 and 1.15? Determine the percentage in between these scores. Draw the curve and show your complete solution. A.0.nceco eng - 0.0. *- .33 0. qiro Te PNTe nN M LIS The percentage that is in between the raw scores of 8.2474 and 9.3857 is 33.9%.

MATLAB: An Introduction with Applications
6th Edition
ISBN:9781119256830
Author:Amos Gilat
Publisher:Amos Gilat
Chapter1: Starting With Matlab
Section: Chapter Questions
Problem 1P

Related questions
Question
#15 handwritten
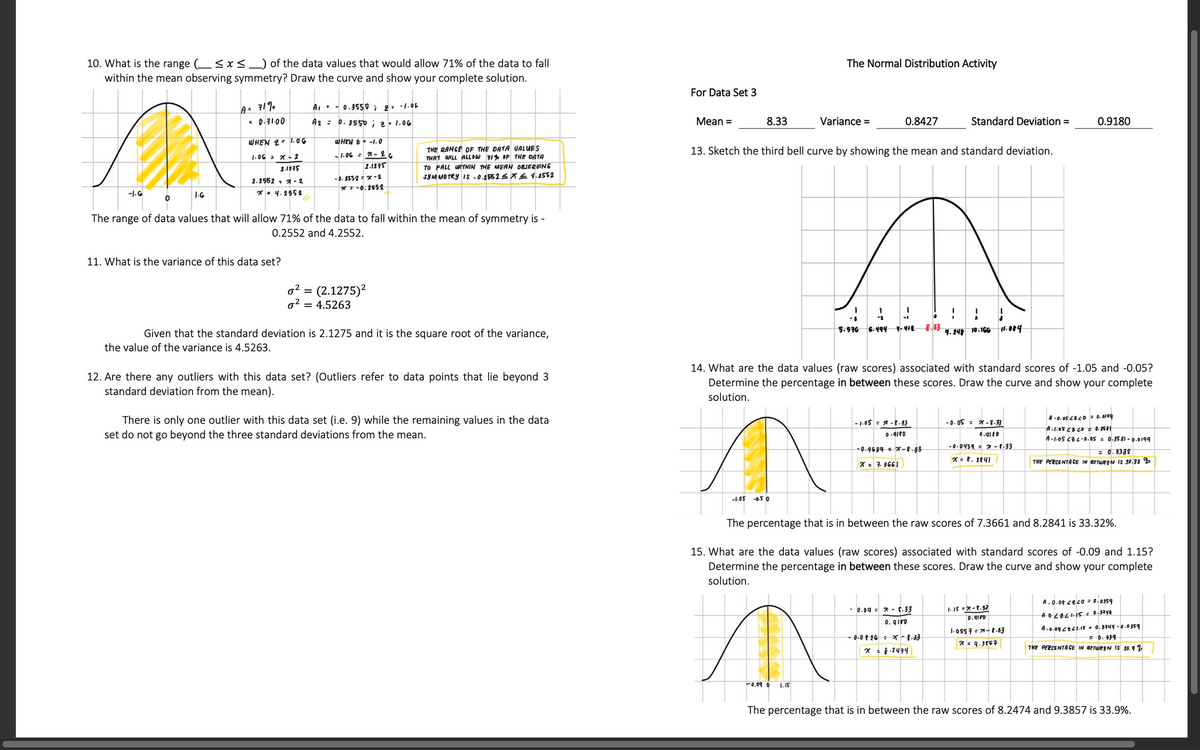
Transcribed Image Text:10. What is the range (sxS_) of the data values that would allow 71% of the data to fall
within the mean observing symmetry? Draw the curve and show your complete solution.
The Normal Distribution Activity
For Data Set 3
A. 717.
• 0.100
Variance =
A: : 0. J55; e1.06
Mean =
8.33
0.8427
Standard Deviation =
0,9180
WHEN LOG
THE RANGE OF THE ĐATA UALUES
13. Sketch the third bell curve by showing the mean and standard deviation.
Surt
1.1561..
TO PALL TNIN TNE MEAN ORJEENG
-1. 1
*.st
-1.G
16
The range of data values that will allow 71% of the data to fall within the mean of symmetry is
0.2552 and 4.2552.
11. What is the variance of this data set?
o? = (2.1275)?
o? = 4.5263
Given that the standard deviation is 2.1275 and it is the square root of the variance,
1. N . .n4
the value of the variance is 4.5263.
12. Are there any outliers with this data set? (Outliers refer to data points that lie beyond 3
standard deviation from the mean).
14. What are the data values (raw scores) associated with standard scores of -1.05 and -0.05?
Determine the percentage in between these scores. Draw the curve and show your complete
solution.
There is only one outlier with this data set (i.e. 9) while the remaining values in the data
set do not go beyond the three standard deviations from the mean.
-0. I -I.
THE PECENTAE en .
The percentage that is in between the raw scores of 7.3661 and 8.2841 is 33.32%.
15. What are the data values (raw scores) associated with standard scores of -0.09 and 1.15?
Determine the percentage in between these scores. Draw the curve and show your complete
solution.
A.0.ceco.n
0. gire
I-oss -t
* 9. JES
LIS
The percentage that is in between the raw scores of 8.2474 and 9.3857 is 33.9%.
Expert Solution
This question has been solved!
Explore an expertly crafted, step-by-step solution for a thorough understanding of key concepts.

Step by step
Solved in 2 steps

Recommended textbooks for you
MATLAB: An Introduction with Applications
Statistics
ISBN:
9781119256830
Author:
Amos Gilat
Publisher:
John Wiley & Sons Inc

Probability and Statistics for Engineering and th…
Statistics
ISBN:
9781305251809
Author:
Jay L. Devore
Publisher:
Cengage Learning

Statistics for The Behavioral Sciences (MindTap C…
Statistics
ISBN:
9781305504912
Author:
Frederick J Gravetter, Larry B. Wallnau
Publisher:
Cengage Learning
MATLAB: An Introduction with Applications
Statistics
ISBN:
9781119256830
Author:
Amos Gilat
Publisher:
John Wiley & Sons Inc
Probability and Statistics for Engineering and th…
Statistics
ISBN:
9781305251809
Author:
Jay L. Devore
Publisher:
Cengage Learning
Statistics for The Behavioral Sciences (MindTap C…
Statistics
ISBN:
9781305504912
Author:
Frederick J Gravetter, Larry B. Wallnau
Publisher:
Cengage Learning

Elementary Statistics: Picturing the World (7th E…
Statistics
ISBN:
9780134683416
Author:
Ron Larson, Betsy Farber
Publisher:
PEARSON

The Basic Practice of Statistics
Statistics
ISBN:
9781319042578
Author:
David S. Moore, William I. Notz, Michael A. Fligner
Publisher:
W. H. Freeman

Introduction to the Practice of Statistics
Statistics
ISBN:
9781319013387
Author:
David S. Moore, George P. McCabe, Bruce A. Craig
Publisher:
W. H. Freeman