global warming. The following output presents the average amounts (in metric tons) of carbon dioxide emissions for the years 1999-2006 per person in the United States and per person in the rest of the world in an effort to determine if non-US per person emissions can help predict US per person emissions. US 20.2 20 198 SUMMARY OUTPUT 19.6 Regression Statistics 19.4 Multiple R 0.51622776 19.2 R Square 0.2664911 19 Adjusted R Square 0.2175905 188 Standard Error 0.29668345 Observations 17 186 3.1 3.2 3.3 3.4 35 3.6 3.7 3.8 39 ANOVA df SS MS F ignificance F Regression 1 0.479683973 0.479684 5.44965 0.0338864 Residual 15 1.320316027 0.088021 Total 16 1.8 Coefficients Standard Error t Stat P-value Lower 95% Upper 95% Lower 95.0% Uper 95.0% 19.7831797 25.8195291 Intercept 22.8013544 1.416019771 16.10243 7.1E-11 19.78318 25.819529 0.410961292 -2.33445 0.033886 -1.8353112 -0.0834247 -1.8353112 -0.08342469 Non-US -0.95936795 What is the formula needed to predict US emissions in metric tons if the non-US emissions is 3.4? Oŷ = 22.8 – 0.96(3.4) Oy = 22.8(3.4) – 0.96 Oy = 22.8 – 0.96(3.4) Oŷ = 22.8(3.4) – 0.96 State the correlation value that best respresents the plot presented. O 0.516 O 0.266 -0.516 -0.266
global warming. The following output presents the average amounts (in metric tons) of carbon dioxide emissions for the years 1999-2006 per person in the United States and per person in the rest of the world in an effort to determine if non-US per person emissions can help predict US per person emissions. US 20.2 20 198 SUMMARY OUTPUT 19.6 Regression Statistics 19.4 Multiple R 0.51622776 19.2 R Square 0.2664911 19 Adjusted R Square 0.2175905 188 Standard Error 0.29668345 Observations 17 186 3.1 3.2 3.3 3.4 35 3.6 3.7 3.8 39 ANOVA df SS MS F ignificance F Regression 1 0.479683973 0.479684 5.44965 0.0338864 Residual 15 1.320316027 0.088021 Total 16 1.8 Coefficients Standard Error t Stat P-value Lower 95% Upper 95% Lower 95.0% Uper 95.0% 19.7831797 25.8195291 Intercept 22.8013544 1.416019771 16.10243 7.1E-11 19.78318 25.819529 0.410961292 -2.33445 0.033886 -1.8353112 -0.0834247 -1.8353112 -0.08342469 Non-US -0.95936795 What is the formula needed to predict US emissions in metric tons if the non-US emissions is 3.4? Oŷ = 22.8 – 0.96(3.4) Oy = 22.8(3.4) – 0.96 Oy = 22.8 – 0.96(3.4) Oŷ = 22.8(3.4) – 0.96 State the correlation value that best respresents the plot presented. O 0.516 O 0.266 -0.516 -0.266

Glencoe Algebra 1, Student Edition, 9780079039897, 0079039898, 2018
18th Edition
ISBN:9780079039897
Author:Carter
Publisher:Carter
Chapter10: Statistics
Section: Chapter Questions
Problem 25SGR

Related questions

Question
Transcribed Image Text:Safari
File
Edit
View
History
Bookmarks
Window
Help
Wed 8:01
myopenmath.com
МyOpenMath
G What is the standard deviation of the data set comprising the numbers 3, 7, 4,...
b My Questions | bartleby
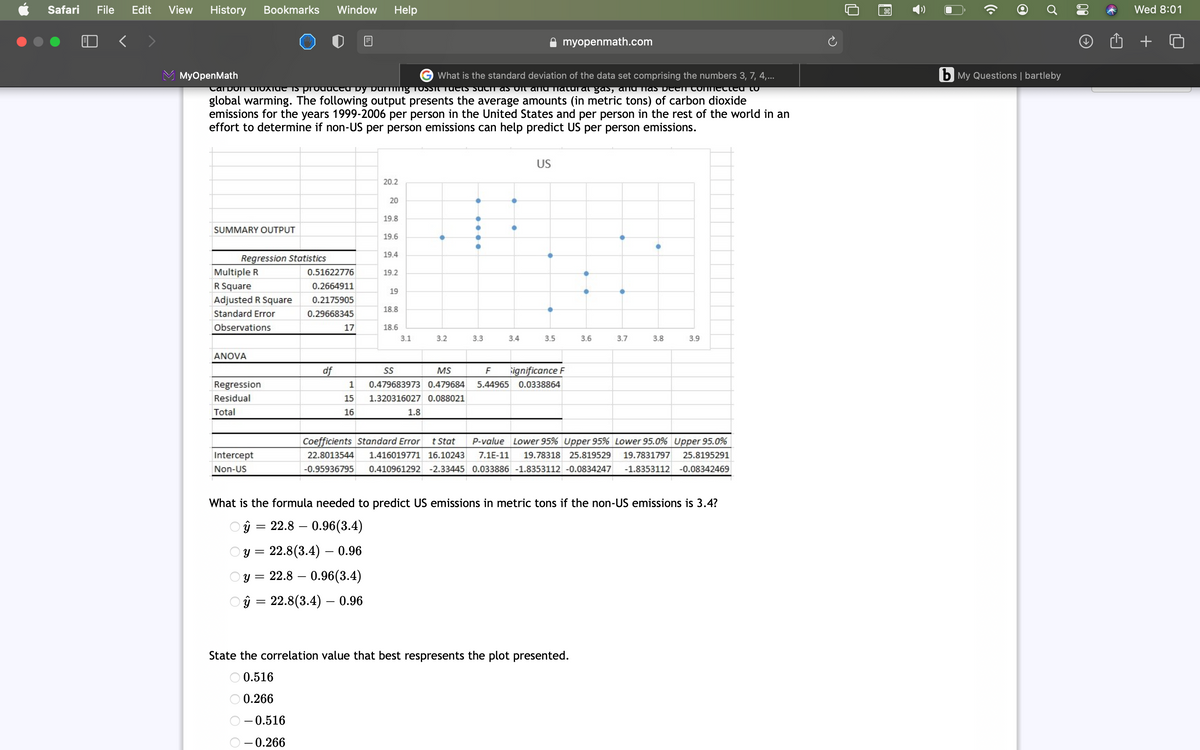
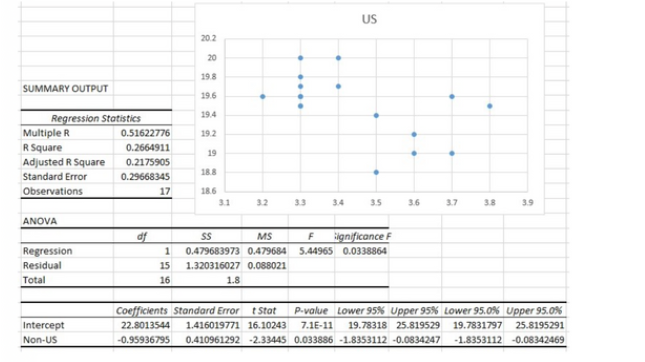
Carbon diOXiUE IS produCed by puing T0SSII TUETS SUCh as oit and laturar gas, ana Tlas pEen ConMEcted tO
global warming. The following output presents the average amounts (in metric tons) of carbon dioxide
emissions for the years 1999-2006 per person in the United States and per person in the rest of the world in an
effort to determine if non-US per person emissions can help predict US per person emissions.
US
20.2
20
19.8
SUMMARY OUTPUT
19.6
19.4
Regression Statistics
Multiple R
0.51622776
19.2
R Square
0.2664911
19
Adjusted R Square
0.2175905
18.8
Standard Error
0.29668345
Observations
17
18.6
3.1
3.2
3.3
3.4
3.5
3.6
3.7
3.8
3.9
ANOVA
df
S
MS
ignificance F
Regression
1
0.479683973 0.479684
5.44965
0.0338864
Residual
15
1.320316027 0.088021
Total
16
1.8
Coefficients Standard Error
t Stat
P-value Lower 95% Upper 95% Lower 95.0% Upper 95.0%
Intercept
22.8013544
1.416019771 16.10243
7.1E-11
19.78318 25.819529
19.7831797
25.8195291
Non-US
-0.95936795
0.410961292 -2.33445 0.033886 -1.8353112 -0.0834247
-1.8353112
-0.08342469
What is the formula needed to predict US emissions in metric tons if the non-US emissions is 3.4?
O ŷ = 22.8 – 0.96(3.4)
y = 22.8(3.4) – 0.96
Oy = 22.8 – 0.96(3.4)
O ŷ = 22.8(3.4) – 0.96
State the correlation value that best respresents the plot presented.
O 0.516
0.266
0.516
- 0.266
00
Expert Solution
Step 1
Given regression analysis
Predicted equation is given by
ŷ = 22.8 - 0.96(x)

Trending now
This is a popular solution!

Step by step
Solved in 2 steps with 2 images

Knowledge Booster


Learn more about
Need a deep-dive on the concept behind this application? Look no further. Learn more about this topic, statistics and related others by exploring similar questions and additional content below.Recommended textbooks for you
Glencoe Algebra 1, Student Edition, 9780079039897…
Algebra
ISBN:
9780079039897
Author:
Carter
Publisher:
McGraw Hill
Glencoe Algebra 1, Student Edition, 9780079039897…
Algebra
ISBN:
9780079039897
Author:
Carter
Publisher:
McGraw Hill