Goodness of Fit Test Frequency Frequency Expected Observed Survey Results Number Company A Company B Company C 30 Company A 32 50 Company B 94 20 Company C 74 Test Statistics Degrees of Freedom p-value »We have three companies that have the following (Expected Frequency) market shares: ÞA 30 % of the market (type the number no need to convert to %) B 50 % of the market C 20 % of the market »Invoke the Macro (Ctri m)to get your survey results for both tests. Calculations 100 30 50.00 1.92875E-22 20 Survey Results Company A Company B »Now some genius in Company C comes up with a major marketing idea fo a new change in the product. So they do a test marketing study of 200 people and they have compiled the new data (hint: you must convert the responses to % or convert above market shares to the expected number of respondents out of 200). Percent Fompany
Goodness of Fit Test Frequency Frequency Expected Observed Survey Results Number Company A Company B Company C 30 Company A 32 50 Company B 94 20 Company C 74 Test Statistics Degrees of Freedom p-value »We have three companies that have the following (Expected Frequency) market shares: ÞA 30 % of the market (type the number no need to convert to %) B 50 % of the market C 20 % of the market »Invoke the Macro (Ctri m)to get your survey results for both tests. Calculations 100 30 50.00 1.92875E-22 20 Survey Results Company A Company B »Now some genius in Company C comes up with a major marketing idea fo a new change in the product. So they do a test marketing study of 200 people and they have compiled the new data (hint: you must convert the responses to % or convert above market shares to the expected number of respondents out of 200). Percent Fompany

College Algebra (MindTap Course List)
12th Edition
ISBN:9781305652231
Author:R. David Gustafson, Jeff Hughes
Publisher:R. David Gustafson, Jeff Hughes
Chapter8: Sequences, Series, And Probability
Section8.7: Probability
Problem 54E: Conditional probability If 40 of the population have completed college, and 85 of college graduates...

Related questions
Question
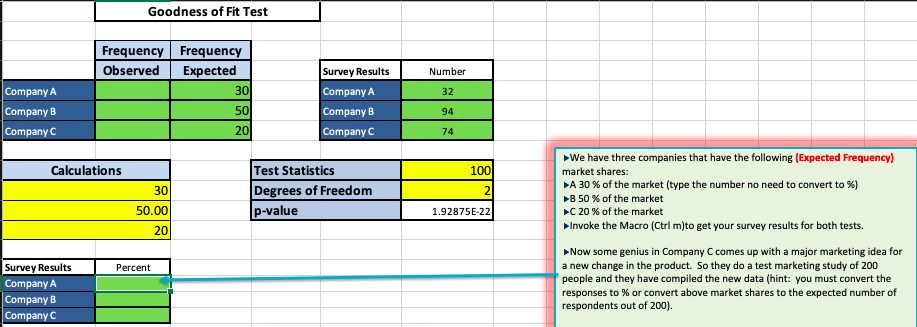
I was able to find some of the information (as seen in picture) but am having trouble finding the Frequency Observed for company A, B, C and then the percent for each of the companies in the survey results section. Attachted is picture for reference on what I am talking about. Thank you!
Transcribed Image Text:Goodness of Fit Test
Frequency
Frequency
Еxpected
Observed
Survey Results
Number
Company A
30
Company A
32
|Company B
Company B
50
94
Company C
20
Company C
74
Test Statistics
We have three companies that have the following (Expected Frequency)
market shares:
Calculations
100
ÞA 30 % of the market (type the number no need to convert to %)
30
Degrees of Freedom
2.
B 50 % of the market
p-value
C 20 % of the market
Invoke the Macro (Ctrl m)to get your survey results for both tests.
50.00
1.92875E-22
20
•Now some genius in Company C comes up with a major marketing idea for
a new change in the product. So they do a test marketing study of 200
people and they have compiled the new data (hint: you must convert the
responses to % or convert above market shares to the expected number of
respondents out of 200).
Survey Results
Percent
Company A
Company B
Company C
Expert Solution
Step 1
From the data we have, observed frequency as,
|
Survey results |
Number |
|
Company A |
32 |
|
Company B |
94 |
|
Company C |
74 |
|
Total |
200 |
Expected percent frequency are,
|
Survey results |
Expected percent frequency |
|
Company A |
30 |
|
Company B |
50 |
|
Company C |
20 |
|
Total |
100 |

Trending now
This is a popular solution!

Step by step
Solved in 2 steps

Knowledge Booster


Learn more about
Need a deep-dive on the concept behind this application? Look no further. Learn more about this topic, statistics and related others by exploring similar questions and additional content below.Recommended textbooks for you
College Algebra (MindTap Course List)
Algebra
ISBN:
9781305652231
Author:
R. David Gustafson, Jeff Hughes
Publisher:
Cengage Learning
College Algebra (MindTap Course List)
Algebra
ISBN:
9781305652231
Author:
R. David Gustafson, Jeff Hughes
Publisher:
Cengage Learning