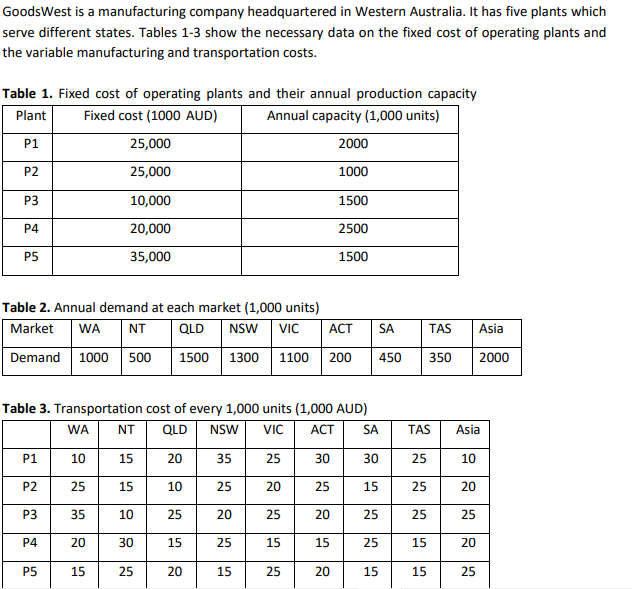
GoodsWest is a manufacturing company headquartered in Western Australia. It has five plants which serve different states. Tables 1-3 show the necessary data on the fixed cost of operating plants and the variable manufacturing and transportation costs. Table 1. Fixed cost of operating plants and their annual production capacity Fixed cost (1000 AUD) Plant Annual capacity (1,000 units) P1 25,000 25,000 10,000 20,000 35,000 P2 P3 P4 P5 Table 2. Annual demand at each market (1,000 units) Market WA NT QLD NSW VIC ACT SA Demand 1000 500 1500 1300 1100 200 450 Table 3. Transportation cost of every 1,000 units (1,000 AUD) WA NT QLD NSW VIC ACT SA 10 1200 20 35 25 30 30 25 25 20 25 15 35 20 25 20 25 20 25 15 15 25 15 15 25 20 15 P1 P2 P3 P4 P5 2000 1000 1500 2500 1500 10 30 25 25 15 20 TAS 350 TAS 25 25 25 15 15 Asia 2000 Asia 10 20 25 20 25


EDIT: I have edited the part of questions and now it is clearly mentioned what to do here quick response would be appreciated
The questions are based upon the table given below and the subject name is supply chain analytics.The table is attached after the questions.Kindly read the whole question first before asking me to edit. Any valid response will be highly appreciated.
Note : Every question is independent of the previous ones.
Note . Explain your findings for each question in simple terms.
1. How many products should be transported from each manufacturer to each market to minimize the total cost for GoodsWest?
2. What is the total cost for GoodsWest in the optimal situation?
3. From Australian markets, WA, NSW, and VIC want to be single-sourced. What are the optimal transportation quantities and the total cost in this case?
4. Due to the COVID-19 pandemic, demand in QLD has decreased to 1000 and Asian demand has decreased to 1500.What is the optimal transportation planning in this case? Which plant should be closed to minimize the total cost?
5. GoodsWest is considering feeding the Asian market just from P3 and P4. What are the cost implications of this decision?

Step by step
Solved in 5 steps with 9 images
