Graduation Rates. Use the technology of your choice to obtain the requested point estimate and confidence interval for the mean graduation rate, and the predicted value and prediction interval for the graduation rate of a school where the student-to-faculty ratio is 18 to 1, 70% of the freshmen were in the top 10% of their high school class, and 75% of the applicants are accepted.


Graduation Rates. Use the technology of your choice to obtain the requested point estimate and confidence interval for the mean graduation rate, and the predicted value and prediction interval for the graduation rate of a school where the student-to-faculty ratio is 18 to 1, 70% of the freshmen were in the top 10% of their high school class, and 75% of the applicants are accepted.
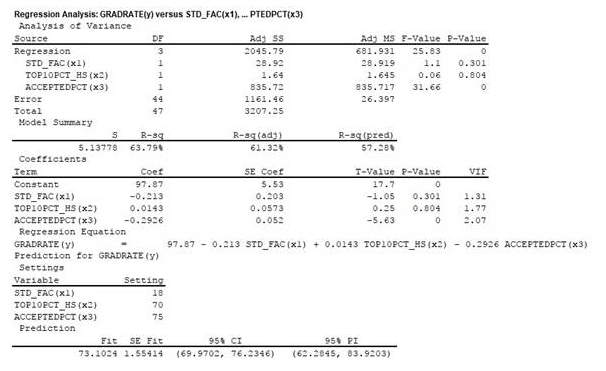
The data gives graduation rates for colleges and universities (y), calculated as the percentage of freshmen who enter, attend the course full-time and graduate within 5 years, along with their student-to-faculty ratio (x1, percentage of freshmen in the top 10% of their high school class (x2) and percentage of accepted applicants (x3).
Regression and prediction:
- Choose Stat > Regression > Regression > Fit Regression Model.
- Under Responses, enter the column of GRADRATE (y).
- Under Continuous predictors, enter the columns of STD_FAC(x1), TOP10PCT_HS(x2), ACCEPTEDPCT(x3).
- Click Results and select options Method, Analysis of variance, Model summary, Coefficients, Regression equation and click OK.
- Click OK.
- Choose Stat > Regression > Regression > Predict.
- Enter the value of STD_FAC(x1)(x1) as 18, the value of TOP10PCT_HS(x2) as 70 and the value of ACCEPTEDPCT(x3) as 75.
- Click Options, enter the Confidence level as 95, choose the Type of interval as Two-sided and click OK.
- Click OK.
The output using Minitab software is given as,
Point estimate:
Point estimate for mean response:
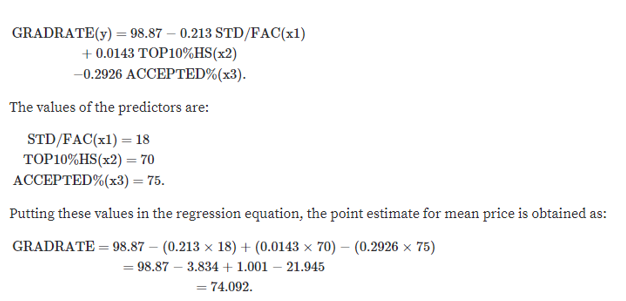
The point estimate for mean response at given values of the predictors is the value of the response variables obtained by substituting the values of the predictors in the sample regression equation.
Careful inspection of the output shows that the regression equation is given as:

Trending now
This is a popular solution!

Step by step
Solved in 2 steps with 2 images


