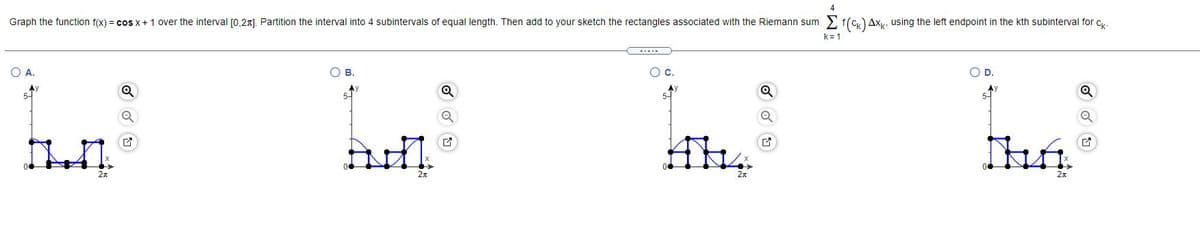
Graph the function f(x) = cos x+1 over the interval (0.2x) Partition the interval into 4 subintervals of equal length. Then add to your sketch the rectangles associated with the Riemann sum E () Ax. using the left endpoint in the kth subinterval for c k=1 OA. OB. Oc. OD.
Graph the function f(x) = cos x+1 over the interval (0.2x) Partition the interval into 4 subintervals of equal length. Then add to your sketch the rectangles associated with the Riemann sum E () Ax. using the left endpoint in the kth subinterval for c k=1 OA. OB. Oc. OD.

Chapter3: Functions
Section3.3: Rates Of Change And Behavior Of Graphs
Problem 2SE: If a functionfis increasing on (a,b) and decreasing on (b,c) , then what can be said about the local...

Related questions
Question
100%
How would I go about solving this?
Transcribed Image Text:4
Graph the function f(x) = cos x + 1 over the interval [0,21). Partition the interval into 4 subintervals of equal length. Then add to your sketch the rectangles associated with the Riemann sum
f(cx) Axg, using the left endpoint in the kth subinterval for c.
k= 1
O A.
Ов.
о с.
OD.
本y
5-
5-
5-
5-
2x
2л
Expert Solution
This question has been solved!
Explore an expertly crafted, step-by-step solution for a thorough understanding of key concepts.

This is a popular solution!

Trending now
This is a popular solution!

Step by step
Solved in 2 steps with 1 images

Recommended textbooks for you

Intermediate Algebra
Algebra
ISBN:
9781285195728
Author:
Jerome E. Kaufmann, Karen L. Schwitters
Publisher:
Cengage Learning

Algebra & Trigonometry with Analytic Geometry
Algebra
ISBN:
9781133382119
Author:
Swokowski
Publisher:
Cengage
Intermediate Algebra
Algebra
ISBN:
9781285195728
Author:
Jerome E. Kaufmann, Karen L. Schwitters
Publisher:
Cengage Learning
Algebra & Trigonometry with Analytic Geometry
Algebra
ISBN:
9781133382119
Author:
Swokowski
Publisher:
Cengage