
Holt Mcdougal Larson Pre-algebra: Student Edition 2012
1st Edition
ISBN:9780547587776
Author:HOLT MCDOUGAL
Publisher:HOLT MCDOUGAL
Chapter12: Angle Relationships And Transformations
Section12.4: Translations
Problem 17E

Related questions
Question
100%
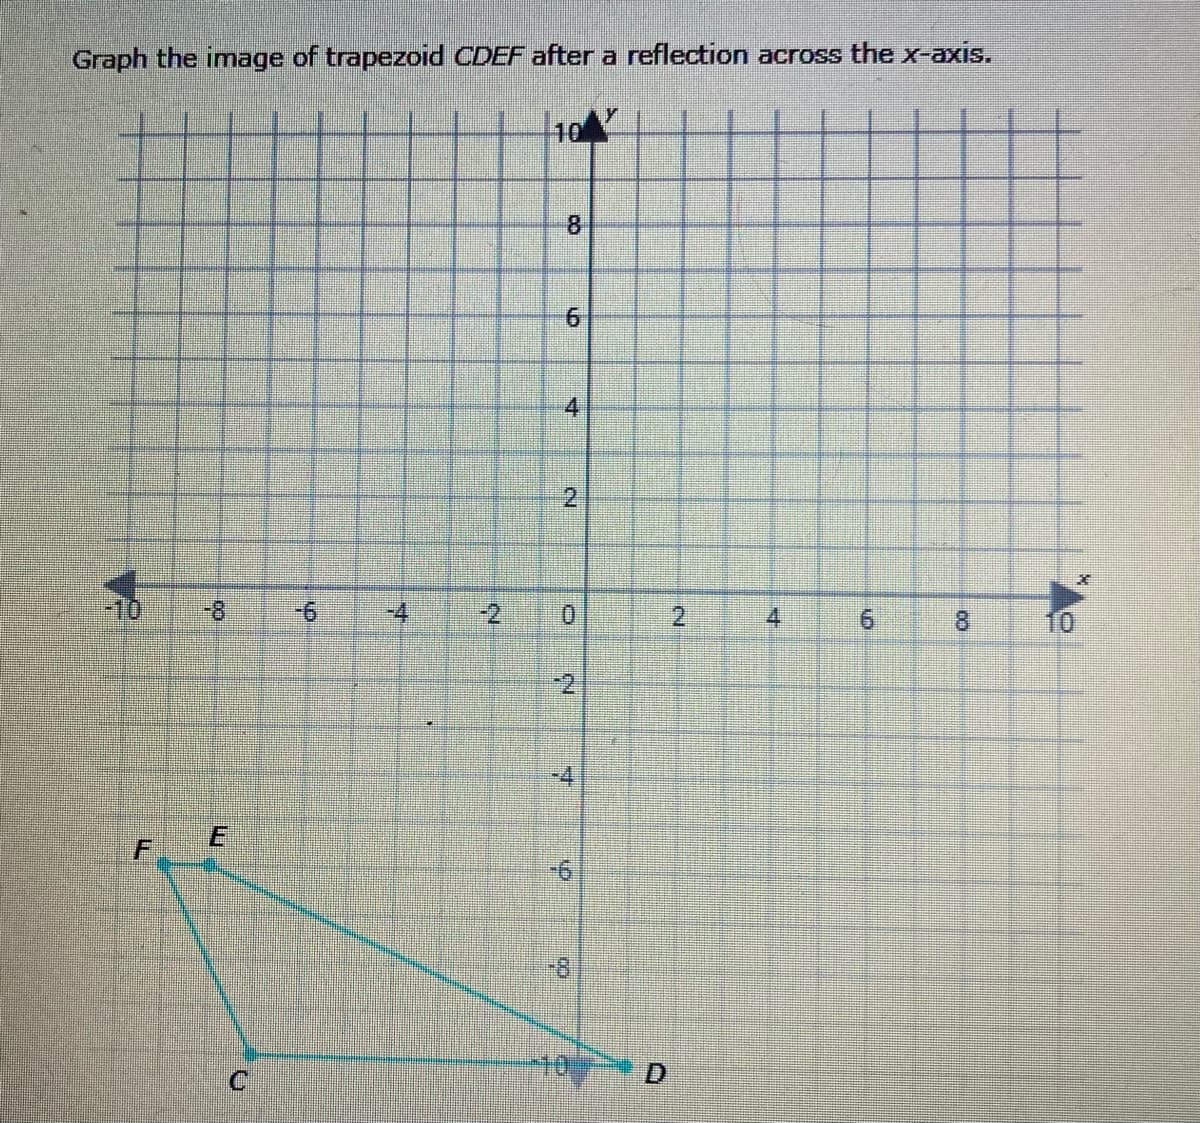
Transcribed Image Text:Graph the image of trapezoid CDEF after a reflection across the x-axis.
10
8
6.
4.
2.
-10
-8
9-1
-4
-2
0.
2.
8.
10
-2
-4
6.
Expert Solution
Step 1
If a co-ordinate (x,y) is reflected across the x-axis, the new co-ordinate will be (x,-y).

Trending now
This is a popular solution!

Step by step
Solved in 3 steps with 2 images

Recommended textbooks for you
Holt Mcdougal Larson Pre-algebra: Student Edition…
Algebra
ISBN:
9780547587776
Author:
HOLT MCDOUGAL
Publisher:
HOLT MCDOUGAL
Holt Mcdougal Larson Pre-algebra: Student Edition…
Algebra
ISBN:
9780547587776
Author:
HOLT MCDOUGAL
Publisher:
HOLT MCDOUGAL