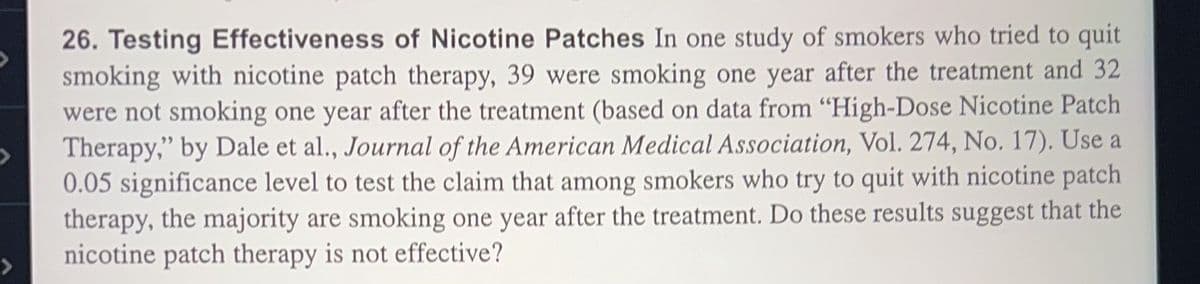
> 26. Testing Effectiveness of Nicotine Patches In one study of smokers who tried to quit smoking with nicotine patch therapy, 39 were smoking one year after the treatment and 32 were not smoking one year after the treatment (based on data from "High-Dose Nicotine Patch Therapy," by Dale et al., Journal of the American Medical Association, Vol. 274, No. 17). Use a 0.05 significance level to test the claim that among smokers who try to quit with nicotine patch therapy, the majority are smoking one year after the treatment. Do these results suggest that the nicotine patch therapy is not effective?
> 26. Testing Effectiveness of Nicotine Patches In one study of smokers who tried to quit smoking with nicotine patch therapy, 39 were smoking one year after the treatment and 32 were not smoking one year after the treatment (based on data from "High-Dose Nicotine Patch Therapy," by Dale et al., Journal of the American Medical Association, Vol. 274, No. 17). Use a 0.05 significance level to test the claim that among smokers who try to quit with nicotine patch therapy, the majority are smoking one year after the treatment. Do these results suggest that the nicotine patch therapy is not effective?

College Algebra (MindTap Course List)
12th Edition
ISBN:9781305652231
Author:R. David Gustafson, Jeff Hughes
Publisher:R. David Gustafson, Jeff Hughes
Chapter8: Sequences, Series, And Probability
Section8.7: Probability
Problem 58E: What is meant by the sample space of an experiment?

Related questions
Question
I need help on question 26
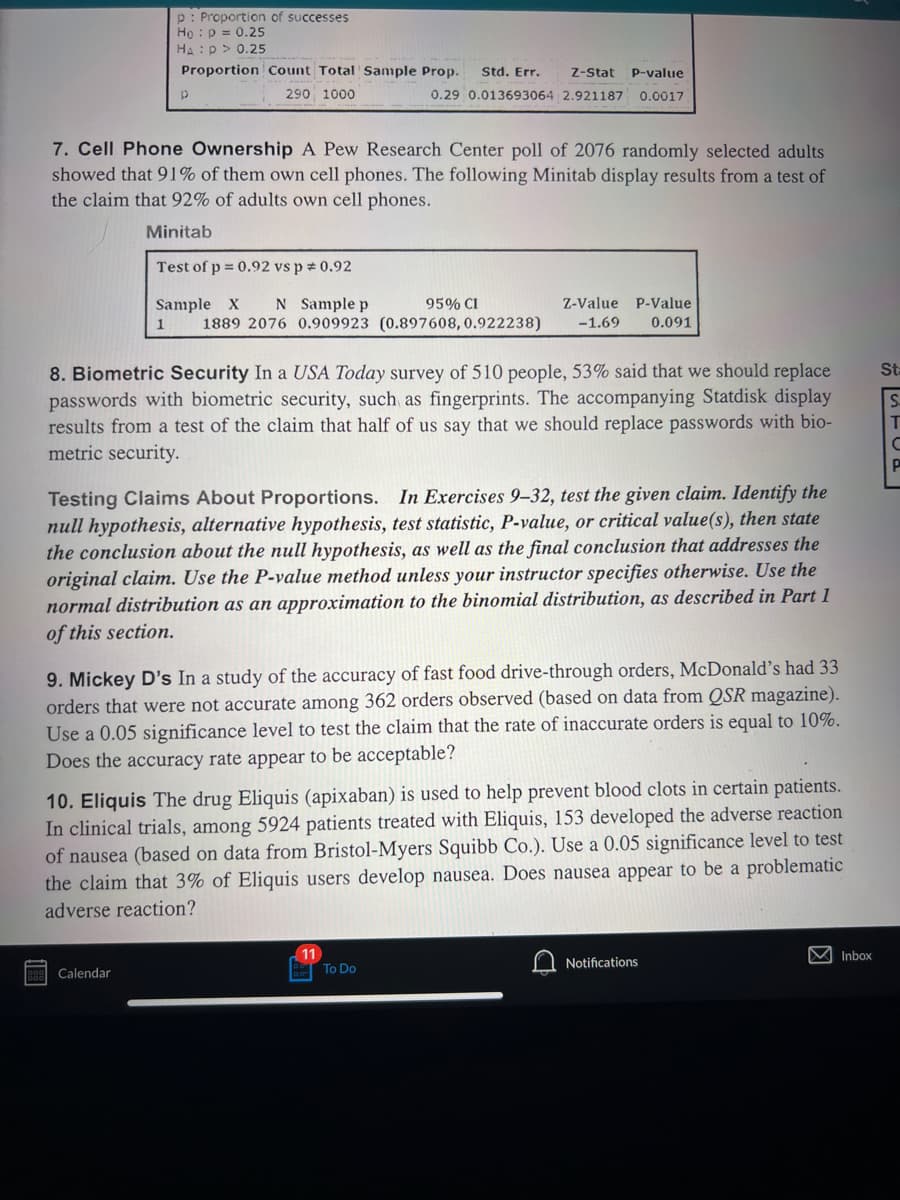
Transcribed Image Text:p: Proportion of successes
Ho p = 0.25
HA: P > 0.25
Proportion Count Total Sample Prop.
290 1000
p
7. Cell Phone Ownership A Pew Research Center poll of 2076 randomly selected adults
showed that 91% of them own cell phones. The following Minitab display results from a test of
the claim that 92% of adults own cell phones.
Minitab
Std. Err. Z-Stat P-value
0.29 0.013693064 2.921187 0.0017
Test of p = 0.92 vs p = 0.92
95% CI
Sample X N Sample p
Z-Value P-Value
1 1889 2076 0.909923 (0.897608, 0.922238) -1.69 0.091
8. Biometric Security In a USA Today survey of 510 people, 53% said that we should replace
passwords with biometric security, such as fingerprints. The accompanying Statdisk display
results from a test of the claim that half of us say that we should replace passwords with bio-
metric security.
Calendar
Testing Claims About Proportions. In Exercises 9-32, test the given claim. Identify the
null hypothesis, alternative hypothesis, test statistic, P-value, or critical value(s), then state
the conclusion about the null hypothesis, as well as the final conclusion that addresses the
original claim. Use the P-value method unless your instructor specifies otherwise. Use the
normal distribution as an approximation to the binomial distribution, as described in Part 1
of this section.
9. Mickey D's In a study of the accuracy of fast food drive-through orders, McDonald's had 33
orders that were not accurate among 362 orders observed (based on data from QSR magazine).
Use a 0.05 significance level to test the claim that the rate of inaccurate orders is equal to 10%.
Does the accuracy rate appear to be acceptable?
10. Eliquis The drug Eliquis (apixaban) is used to help prevent blood clots in certain patients.
In clinical trials, among 5924 patients treated with Eliquis, 153 developed the adverse reaction
of nausea (based on data from Bristol-Myers Squibb Co.). Use a 0.05 significance level to test
the claim that 3% of Eliquis users develop nausea. Does nausea appear to be a problematic
adverse reaction?
To Do
Notifications
M Inbox
St
STOE
C
P
Transcribed Image Text:26. Testing Effectiveness of Nicotine Patches In one study of smokers who tried to quit
smoking with nicotine patch therapy, 39 were smoking one year after the treatment and 32
were not smoking one year after the treatment (based on data from "High-Dose Nicotine Patch
Therapy," by Dale et al., Journal of the American Medical Association, Vol. 274, No. 17). Use a
0.05 significance level to test the claim that among smokers who try to quit with nicotine patch
therapy, the majority are smoking one year after the treatment. Do these results suggest that the
nicotine patch therapy is not effective?
Expert Solution
This question has been solved!
Explore an expertly crafted, step-by-step solution for a thorough understanding of key concepts.

Step by step
Solved in 4 steps

Recommended textbooks for you
College Algebra (MindTap Course List)
Algebra
ISBN:
9781305652231
Author:
R. David Gustafson, Jeff Hughes
Publisher:
Cengage Learning

College Algebra (MindTap Course List)
Algebra
ISBN:
9781305652231
Author:
R. David Gustafson, Jeff Hughes
Publisher:
Cengage Learning