> Question 3 
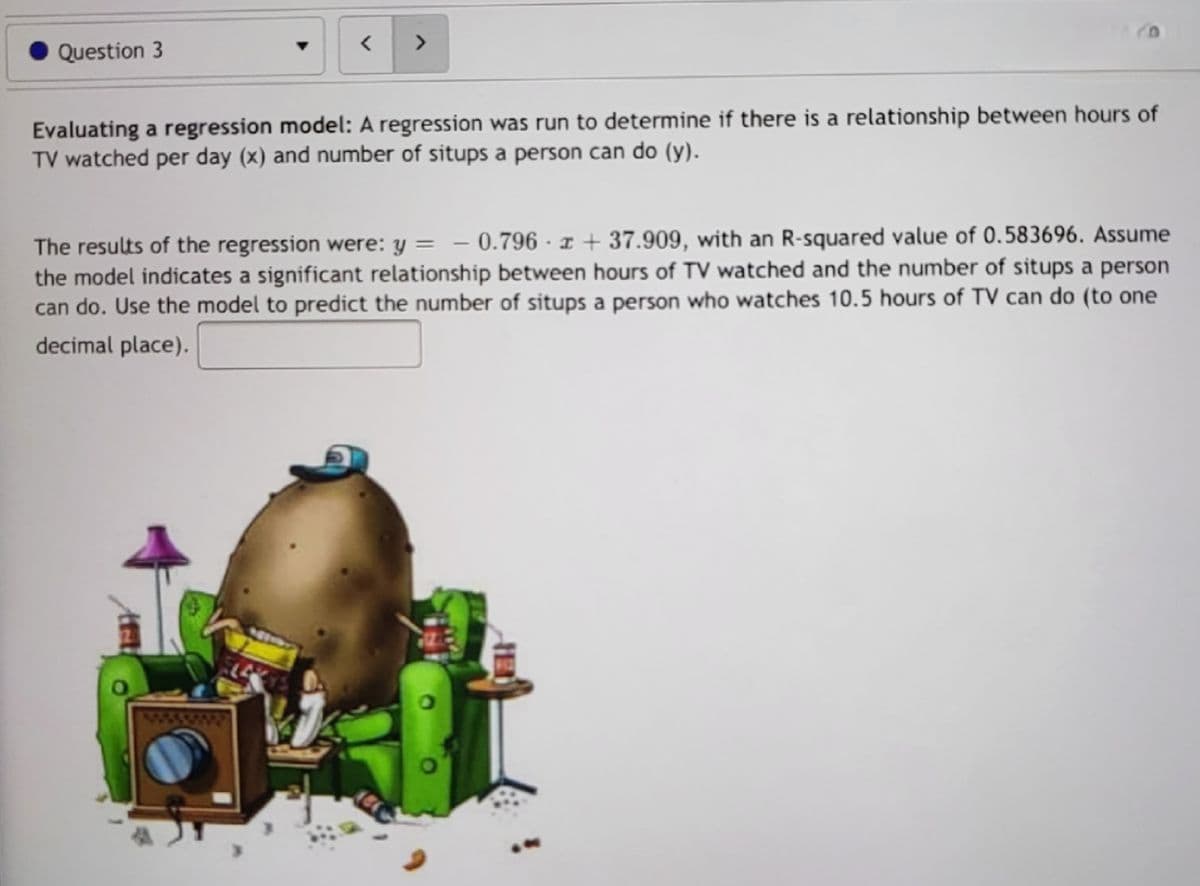
Evaluating a regression model: A regression was run to determine if there is a relationship between hours of TV watched per day (x) and number of situps a person can do (y). The results of the regression were: y = - 0.796 · r + 37.909, with an R-squared value of 0.583696. Assume the model indicates a significant relationship between hours of TV watched and the number of situps a person can do. Use the model to predict the number of situps a person who watches 10.5 hours of TV can do (to one decimal place).
Q: A certain story, describing several weeks of a long war, includes many details of injuries and…
A: Solution: Given information: n= 148 Total observation r= 3 number of row c= 2 number of column
Q: I Date in the repetitve distribytion ta ble is claises o- 214-16-18-11o2-14 517 3 2 4 © variation…
A: Coefficient of variation is used to measure the variability in the data set. It is calculated by…
Q: Find the 20%20% trimmed mean of the following data. If necessary, round to one more decimal place…
A: The trimmed mean is calculated as, 20*20/100 = 4 data points are removed from each end and calculate…
Q: Find the density function of the random variable X if the characteristic function is [1–| @| |@S1 Øx…
A:
Q: Find an ordered pair (x, y) that is a solution to the equation. 2x-y=9 (x. y) = (D
A: Given the equation: - 2x - y = 9
Q: You are conducting a test of homogeneity for the claim that two different populations have the same…
A: Given that,
Q: 7. 50 percent of the imports of barley into a country came from Dominions, 80 percent of the total…
A:
Q: a) A random variable has a binomial distribution. Find, Variance
A:
Q: If ø,(@) is a characteristic function of a random varlable d, function of Y = aX +b is given by P,…
A:
Q: (a) How much does the amount of water increase for each hour that water is added? Oliters (b) What…
A: here use given regression line for time in hour and water in pond (liter )
Q: In an experiment, the average mark was 76.5 and the standard deviation 9.5.If 15% of the class…
A: Given: the average mark was 76.5 and the standard deviation 9.5. the 15% of the class scored grade A…
Q: Music producer, will receive royalties over a period of 3 years for the theme song she made for a TV…
A:
Q: MY NOTES ASK YOUR TEACHER in the flowing problem, check thattappropriate te ue he malpormation te…
A: "Since you have posted a question with multiple subparts, we will solve first 3 sub-parts for you.…
Q: A member of the city government thinks that 90 percent confidence isn't enough. He wants to be 99…
A: Given that A member of the city government thinks that 90 percent confidence isn't enough. He wants…
Q: The loss-prevention officer of a large department-store chain is interested in finding out how…
A: The questionnaire to find out how prevalent employee theft is randomly sent to 1000 employees. Out…
Q: If we have a dummy variable with 15 levels, we need to add 15 variables into a linear/ logistic…
A: Question: If we have a dummy variable with 15 levels we need to add 15 variables into a…
Q: The actual volume of seven oil cans labeled as 12 liters are as follows: 11.77, 11.90, 11.64, 11.84,…
A:
Q: The homework policy at an elementayr school is that students in 5th grade should spend an average of…
A:
Q: A large bank vault has several automatic burglar alarms. The probability is 0.6 that a single alarm…
A: From the provided information, The probability is 0.6 that a single alarm will detect a burglar that…
Q: distributed. At what observed level of significance, is this sample standard deviation of the number…
A: here given , sample size = n = 17 sample standard deviation = 5.86
Q: This problem is inspired by a study of the "gender gap" in earnings in top corporate jobs (Bertrand…
A: Hello! As you have posted more than 3 sub parts, we are answering the first 3 sub-parts. In case…
Q: 20. Ron and Sandy have purchased their first house. They borrowed $174, 000 for 30 years at an…
A:
Q: Q6 The actual volume of seven oil cans labeled as 12 liters are as follows: 11.77, 11.90, 11.64,…
A: We have given that, The data set are :- 11.77, 11.90, 11.64, 11.84, 12.13, 11.99, 11.77 Then, We…
Q: Scenario: A researcher wants to know whether a hard copy of a textbook provides additional benefits…
A: Introduction: It is required to identify the most suitable option.
Q: True or false If we have a dummy variable with 15 levels, we need to add 15 variables into a linear/…
A: The dummy variables are concepts used in the regression analysis when we have a categorical…
Q: You wish to test the following clalm (HA) at a significance level of a = 0.005. For the context of…
A: Given data : n =197 x̄ = 2.3 s= 21.4 μ= 0 α= 0.005
Q: le indistinguishable particles are to be distributed among the 4 equally spaced wn in the table)…
A:
Q: In a hypothesis test with a null hypothesis H0 : p = 0.4 versus a alternative hypothesis HA: p > 0.4…
A:
Q: The joint PDF of two continuous random variables X and y is given: S(x, y) = et), x>0, y > 0. Let U…
A: Solution
Q: The times (in seconds) taken to execute computer codes written by 16 students are given below. 78…
A: Question: The times (in seconds) taken to execute computer codes written by 16 students are given…
Q: utes) of working adults (the given frequencies wer read from a graph that appeared in the San Luis…
A: (a) The unequal intervals might be used to avoid the situation when few of the class intervals have…
Q: A random sample of 1000 adults has the elements of the sample classified by sex (= Male or Female)…
A: A random sample of 1000 adults has the elements of the sample classified by sex (= Male or Female)…
Q: What is the null hypothesis? What is the alternate hypothesis? Is this a left tail, right tail, or…
A: here AS PER GUIDELINES I HAVE CALCULATED 3 SUBPARTS HERE given , Penelope the prize-winning puzzle…
Q: Find the AM for the following distribution: Class 350 -369 370 -389 390 -409 410 - 429 430 -449 450…
A: A can be any value in the middle. However, for an odd number of class intervals, A is normally used,…
Q: 3 balls of different colors are numbered 1,2, and 3. Construct a sampling distribution with n=2…
A: Solution-: Given: N=3, n=2 Construct a sampling distribution with n=2 (without replacement) then…
Q: Laura learned that the average GPA in her school is 3.6 with a standard deviation of 0.3. (a) If her…
A: see below
Q: 26. The result of the study presents the findings that can only confirm or reject the hypothesis…
A: Given two statements, we have to write the statements true or false.
Q: The table below shows the examination results of 100 students as a percentage Exam Result (%)…
A: “Since you have posted a question with multiple sub-parts, we will solve the first three sub-parts…
Q: A student takes a multiple-choice exam with 15 questions, where each questions have five possible…
A: "Since you have posted a question with multiple subparts, we will solve first 3 sub-parts for you.…
Q: Students were asked how many minutes did they spend studying for Test 1. The following histogram…
A: Given:
Q: If the population consists of numbers 1,2,3,4,5 and 6 find the mean of the samples of size 3…
A: Given: The population consists of 1, 2, 3, 4, 5 and 6 The objective is to find the mean of the…
Q: Let X and Y be continuous random variables with the joint density function: kæy ,if 0 <as asus0.78…
A: Solution
Q: A researcher wishes to try three different techniques to lower the blood pressure of individuals…
A:
Q: Raina has a deck of 10 cards numbered 1 through 10. She is playing a game of chance. This game is…
A: The answer is attached below,
Q: ilidsdovg eris A 8 ols at 1od/ prinniw to ando erit sdoc C
A:
Q: 11q10 Find the 5 number summary for the data shown 20 24 25 30 33 41 42 44 56 65 76 79 89 92 5…
A:
Q: A product engineer wants to optimize the cutting of strips of wood, which are used to make plywood.…
A: Hello! As you have posted more than 3 sub parts, we are answering the first 3 sub-parts. In case…
Q: Suppose the P value in a two tailed test is .0134. Based on the same population, sample and null…
A: Given p-value of the two-tailed test = 0.0134.
Q: 6. A social survey in a village revealed that there were more uneducated males than educated ones,…
A:
Q: a. Use class intervals of $0 to <$3, $3 to <S6, $6 to <$9, etc., to create a relative frequency…
A: (a) CLASS FREQUECY RELATIVE FREQUENCY 0 - <3 7 7/51=0.1373 3 - <6 3 3/51=0.0588 6 -…
Step by step
Solved in 2 steps
- The following fictitious table shows kryptonite price, in dollar per gram, t years after 2006. t= Years since 2006 0 1 2 3 4 5 6 7 8 9 10 K= Price 56 51 50 55 58 52 45 43 44 48 51 Make a quartic model of these data. Round the regression parameters to two decimal places.Find the equation of the regression line for the following data set. x 1 2 3 y 0 3 4Special Rounding Instructions For this exercise set, round all regression parameters to three decimal places, but round all other answers to two decimal places unless otherwise indicated. Postal RatesThe table below shows the cost s, in cents, of a domestic first-class postage stamp in the United States tyears after 1900. t=time,inyearssince1900 s=costofstamp 19 2 32 3 58 4 71 8 78 15 85 22 95 32 102 37 109 44 116 47 a.Use exponential regression to model s as an exponential function of t. b.What cost does your model give for a 1988 stamp? Report your answer to the nearest cent. The actual cost was 25cents. c.Plot the data and the exponential model.
- XYZ Corporation Stock Prices The following table shows the average stock price, in dollars, of XYZ Corporation in the given month. Month Stock price January 2011 43.71 February 2011 44.22 March 2011 44.44 April 2011 45.17 May 2011 45.97 a. Find the equation of the regression line. Round the regression coefficients to three decimal places. b. Plot the data points and the regression line. c. Explain in practical terms the meaning of the slope of the regression line. d. Based on the trend of the regression line, what do you predict the stock price to be in January 2012? January 2013?Special Rounding Instructions. For this exercise set, round all regression parameters to three decimal places, but round all other answers to two decimal places unless otherwise indicated. Growth in Length of HaddockA study by Raitt showed that the maximum length that a haddock could be expected to grow is about 53centimeters.Let D=D(t) denote the difference between 53centimeters and the length at age t years. The table below gives experimentally collected values for D. Age t Difference D 2 28.2 5 16.1 7 9.5 13 3.3 19 1.0 a.Find an exponential model of D as a function of t. b.Let L=L(t) denote the length in centimeters of a haddock at age t years. Find the model for L as a function of t. c.Plot the graph of the experimentally gathered data for the length L at ages 2,5,7,13, and 19years along with the graph of the model you made for L. Does this graph show that the 5year old haddock is a bit shorter or a bit longer than would be expected? d.A fisherman has caught a haddock that measures 41centimeters. What is the approximate age of the haddock?Special Rounding Instructions For this exercise set, round all regression parameters to three decimal places, but round all other answers to two decimal places unless otherwise indicated. Gray Wolves in WisconsinGray wolves were among the first mammals protected under the Endangered Species Act in the 1970s. Wolves recolonized in Wisconsin beginning in 1980.Their population grew reliably after 1985 as follows: Year Wolves Year Wolves 1985 15 1993 40 1986 16 1994 57 1987 18 1995 83 1988 28 1996 99 1989 31 1997 145 1990 34 1998 178 1991 40 1999 197 1992 45 2000 266 a. Explain why an exponential model may be appropriate. b. Are these data exactly exponential? Explain. c. Find an exponential model for these data. d. Plot the data and the exponential model. e. Comment on your graph in part d. Which data points are below or above the number predicted by the exponential model?
- Olympic Pole Vault The graph in Figure 7 indicates that in recent years the winning Olympic men’s pole vault height has fallen below the value predicted by the regression line in Example 2. This might have occurred because when the pole vault was a new event there was much room for improvement in vaulters’ performances, whereas now even the best training can produce only incremental advances. Let’s see whether concentrating on more recent results gives a better predictor of future records. (a) Use the data in Table 2 (page 176) to complete the table of winning pole vault heights shown in the margin. (Note that we are using x=0 to correspond to the year 1972, where this restricted data set begins.) (b) Find the regression line for the data in part ‚(a). (c) Plot the data and the regression line on the same axes. Does the regression line seem to provide a good model for the data? (d) What does the regression line predict as the winning pole vault height for the 2012 Olympics? Compare this predicted value to the actual 2012 winning height of 5.97 m, as described on page 177. Has this new regression line provided a better prediction than the line in Example 2?Special Rounding Instructions For this exercise set, round all regression parameters to three decimal places, but round all other answers to two decimal places unless otherwise indicated. Design Patents The following table shows the number P of design patents awarded by the U.S. Patents and Trademark Office from 1950 through 2010. t = years since 1950 P = patents 0 4718 10 2543 20 3214 30 3949 40 8024 50 17,413 60 22,799 a.Use exponential regression to model P as a function of t. b.Plot the data along with the regression equation. c.In what years were there more patents awarded than might be expected from the model?Special Rounding Instructions. For this exercise set, round all regression parameters to three decimal places, but round all other answers to two decimal places unless otherwise indicated. Caloric Content Versus Shell Length In 1965, Robert T.Paine gathered data on the length L, in millimeters, of the shell and the caloric content C, in calories, for a certain mollusk. The table below is adapted from those data. L=length C=Calories 7.5 92 13 210 20 625 24 1035 31 1480 a.Find an exponential model of calories as a function of length. b.Plot the graph of the data and the exponential model. Which of the data points show a good deal less caloric content than the model would predict for the given length? c.If length is increased by 1millimeter, how is caloric content affected?
- Remainder Round all answers to two decimal places unless otherwise indicated. Cell Phones The following table gives the amount spent on cellular service worldwide, in trillions of U.S. dollars. Round the regression parameters to three decimal places. Date Cellular service revenue 2011 1.01 2012 1.05 2013 1.09 2014 1.11 a.Plot the data points. b.Find the equation of the regression line and add its graph to the plotted data. c.In 2015, 1.14 trillion was spent on cellular service. If you had been a financial strategist in 2014 with only the data in the table above available, what would been your prediction for the amount spent on cellular service in 2015?Zipfs Law The following table shows U.S cities by rank in terms of population and population in thousands. City Rank r Population N New York 1 8491 Chicago 3 2722 Philadelphia 5 1560 Dallas 9 1280 Austin 11 913 San Francisco 13 852 Columbus 15 836 A rule known as Zipfs law tells us that it is reasonable to approximate these data with a power function. a Use power regression to express the population as a function of the rank. b Plot the data along with the power function from part a. c Phoenix is the sixth largest city in the United States. Use your answer from part a to estimate population of Phoenix. Round your answer in thousands to the nearest whole number. Note: The actual population is 1537 thousand.Special Rounding Instructions For this exercise set, round all regression parameters to three decimal places, but round all other answers to two decimal places unless otherwise indicated. Traffic in the Lincoln TunnelCharacteristics of traffic flow include density D, which is the number of cars per mile, and average speed s in milesperhour.Traffic system engineers have investigated several methods for relating density to average speed. One study considered traffic flow in the north tube of the Lincoln Tunnel and fitted an exponential function to observed data. Those data are partially presented in the table below. Speed s Density D 32 34 25 53 20 74 17 88 13 102 a.Make an approximate exponential model of D as a function of s. b.Express, using functional notation, the density of traffic flow when the average speed is 28mileperhour, and then calculate that density. c.If average speed increases by 1mileperhour, what can be said about density?