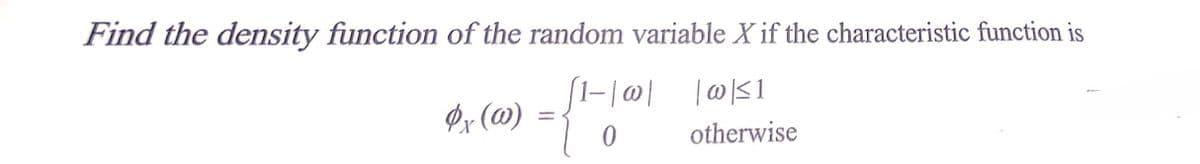
Find the density function of the random variable X if the characteristic function is Ør (@) otherwise


Q: A group of 40 Cabrillo students who were studying and/or being tutored in the HUB were surveyed and…
A: Venn Diagram is a diagrammatic representation to represent sets. The universal set is represented by…
Q: A real estate developer is building a new apartment complex. He wants to know if people have…
A: The categorical variable is floor plan. We have to test whether people have an equal preference for…
Q: According to a report on consumer fraud and identity theft, 20% of all complaints for a year were…
A: Claim : Rhode island had a higher proportion of identify theft than 20% Hypothesis : H0 : p = 0.2…
Q: he area of the shaded region. The graph depicts the standard normal distribution of bone density…
A:
Q: A member of the city government thinks that 90 percent confidence isn't enough. He wants to be 99…
A: Given that A member of the city government thinks that 90 percent confidence isn't enough. He wants…
Q: A poll summarized the results of a survey of 2,400 adults and 500 teens aged 13 to 17. It was…
A:
Q: You come across Professor Cafferty's data set from his Master's thesis and realize that he has data…
A: Claim : they received financial support from their family.
Q: A bag contains 5 red marbles, 9 white marbles, and 6 blue marbles. Randomly choose two marbles, one…
A: According to the given information, we have Red marbles = 5 White marbles = 9 Blue marbles = 6 Total…
Q: Let X and Y be random variables such that Y < X, then show that E[Y]< E[X], provided that the…
A:
Q: Interval Observed 0-20 190 20-40 113 40-60 43 60-80 39 80-100 16 > 100 19 i) Find the Chi-Sq test…
A: The provided information is Interval Observed (O) Expected (E) (O-E) (O-E)2E 0-20 190 70 120…
Q: 1. For a certain year a study reports that the percentage of Americans aged 21 - 30 that had…
A:
Q: What is the null hypothesis? What is the alternate hypothesis? Is this a left tail, right tail, or…
A: here AS PER GUIDELINES I HAVE CALCULATED 3 SUBPARTS HERE given , Penelope the prize-winning puzzle…
Q: Probability 5. The graph of the discrete probability to the right represents the number of live…
A: According to guidelines we solve first three sub parts when given multiple subparts.
Q: B. SERIES 1. Find the sum of all-natural numbers having first term 1 and last term 303. 2. Find the…
A: Solve the first question, unless the student has asked for a specific question to be solved,…
Q: If X, and X, are two independent random variables, then Px, + x, (@) = Øx, (@) Øx, (@) %3D
A:
Q: Use the population of (46, 31, 24, 12) of the amounts of caffeine (mg/12 oz) in four beverages.…
A: 33 a) The objective is to determine the sampling distribution of the sample mean. There are 16…
Q: The loss-prevention officer of a large department-store chain is interested in finding out how…
A: The questionnaire to find out how prevalent employee theft is randomly sent to 1000 employees. Out…
Q: CH710 Many investors and financial analysts believe the Dow Jones Industrial Average (DJIA) gives a…
A:
Q: Consider the following 29 years worth of observed annual rainfall data (in inches) for a certain…
A: (a) Enter the data into the excel sheet as follows: Select the Annual rainfall column data and…
Q: Is the number of games won by a major league baseball team in a season related to the team batting…
A: Calculation: (A) The correlation coefficient is,
Q: A company uses 3 machines X,Y and Z for their production. The company repairs each machine every…
A: Laspeyre's price index formula: P01L=∑p1q0∑p0q0×100 Where, p0= price of commodity in the base yr p1…
Q: the sample proportion who bought a ticket would vary from sample to sample. The sampling…
A: Given Data population proportion,p = 0.60 sample size n = 1523
Q: Find the 5 number summary for the data shown. 1 6 13 16 23 19 51 29 54 67 76 80 91 5 number summary:
A: Given that Data values : 1 , 6 , 13 , 16 , 19 , 23 , 29 , 51 , 54 , 67 , 76 , 80 , 91 Number of…
Q: Scenario: Does studying with background music (X) improve test scores (Y)? Students self-reported…
A: Introduction: It is required to identify the correct type of correlation test to be used.
Q: You are modeling the relationship between two variables using the following regression model: Y, =…
A: Note: As per the guidelines, in case of multiple subparts, answer to first three subparts will be…
Q: Arandom sample of 197 students was asked how many songs were in their digtal music library and what…
A: * SOLUTION :- from the given information the answer is provided as below ,
Q: Suppose we have data coming from 69 i.i.d observations. The sample mean is JÓ28 and the sample…
A:
Q: Express the confidence interval 35.5 % +7% in the form of a trilinear inequality. * <p<
A:
Q: True or false If we have a dummy variable with 15 levels, we need to add 15 variables into a linear/…
A: Given a statement related to linear/ logistic model, we have to write the statements are true or…
Q: Do adults (age 20–45) with children and adults without children have the same distribution of type…
A: Null and alternative hypotheses: Null hypothesis: Null hypothesis is a statement which is tested for…
Q: The following are times (in minutes) taken by employees to complete an inspection of an engine at an…
A:
Q: True or false If we have a dummy variable with 15 levels, we need to add 15 variables into a linear/…
A: A dummy variable is a numerical variable which is used in regression analysis.
Q: A software firm collected data for a sample of 30 computer programmers. A regression analysis can be…
A: Here, SST =599.7855 MST =SST/P = 599.7855/3 =199.9285 SSE =75.9380 MSE =…
Q: 5. Let X have a uniform distribution on the interval (0,2). Given X = x, let Y have a (conditional)…
A:
Q: The table and scatter plot show the time spent texting, x, and the time spent exercising, y, by each…
A: In this case, the time spent texting is the independent variable (x), and the time spent exercising…
Q: A consumer products testing group is evaluating two competing brands of tires, Brand 1 and Brand 2.…
A: Hello! As you have posted more than 3 sub parts, we are answering the first 3 sub-parts. In case…
Q: A company produces two types of solar panels per year: x thousand of type A and y thousand of type…
A:
Q: You want to obtain a sample to estimate a population proportion. Based on previous evidence, you…
A: The Population proportion is 90%; p=0.90 Margin of error is 2%; E=0.02 α=0.05
Q: 1. Which is more informative: confidence intervals or significance tests? A.Significance tests,…
A: CI gives a range of estimates for an unknown parameter.
Q: After running a regression you conduct a hypothesis test of Ho: B = 2.5 versus H1: B * 2.5 is…
A: The hypothesis test on regression is conducted. The null hypo. is H0:β=2.5 The alternate hypo. is…
Q: 8. Determine if the following probability experiment represents a binomial experiment. If not,…
A:
Q: Fast reactions: In a study of reaction times, the time to respond to a visual stimulus (x) and the…
A:
Q: Formulate and test a hypothesis to determine whether there is evidence to that there has been an…
A: here given SlackBoard, a company producing a Learning Management System (LMS) would like to know…
Q: The amount of coffee that people drink per day is normally distributed with a mean of 17 ounces and…
A: a. Assume a random variable X that defines the amount of coffee a randomly selected people drink per…
Q: The cumulative frequency graph below shows the monthly salaries of employees at a large…
A: Given cumulative frequency graph shows the monthly salaries of employees at a large manufacturing…
Q: A dataset contains data on birth weights of 65535 babies born in June 1997 along with variables that…
A: Please find the explanation give, Here we use the table of results given to solve the question.
Q: (a) Company A is an organization whose members possess IQ that are in the top 5% of population in a…
A: “Since you have asked multiple questions, we will solve the first question for you. If you want any…
Q: Identify the class width, class midpoints, and class boundaries for the given frequency…
A: As per guideline expert have to answer first question only dear student please upload other question…
Q: (a) What is the probability that among 12 randomly observed individuals, exactly 7 do not cover…
A: here given , According to a study done by Nick Wilson of Otago University Wellington, the…
Q: 2. Calculate Mean Square Within Group (MSWG) 3. Calculate the F statistic 4. Using the table in the…
A: Use the Excel And Perform the One way anova Followings are the steps to perform the One way anova…

Step by step
Solved in 3 steps with 3 images

- Find a value of k that will make f a probability density function on the indicated interval. ƒ(x) = kx; [1, 5]Find a value of k that will make f a probability density function on the indicated interval.ƒ(x) = kx; [1, 5]Suppose that X is a continuous random variable with density function f(x). If f(x)=k for −5≤x≤3 and f(x)=0 otherwise, determine the value of k.
- find the value of the constant c so that the given function is a probability density function for a random variable over the specified interval. . ƒ(x) = 1/ 6 x over [3, c].1) Let x be a uniform random variable in the interval (0, 1). Calculate the density function of probability of the random variable y where y = − ln x.Find a value of k that will make f a probability density function on the indicated interval.ƒ(x) = kx2; [0, 5]